Gold Surges to $1,785 on the Back of a Weaker Dollar – Can We Go Long?


Good morning, traders,
This Thursday morning, the yellow metal, gold, is trading bullishly in Asia, extending slightly into a third session, due to a falling dollar. Gold futures rose 0.12 percent to $1,787, remaining within the $1,759 to $1,788 range, in which the yellow metal has been moving all week. The dollar, which usually swings in the opposite direction to gold, fell slightly on Thursday, allowing gold to trade at the higher end of its range.
Gold Live Chart
US Federal Reserve officials stance on tapering
Two United States Federal Reserve officials have said that while asset tapering should begin soon, it is too soon to increase interest rates. Fed Governor, Randal Quarles, says he supports an initial effort to begin asset reductions in November 2021. However, he also expressed concern about rising inflationary pressures that could necessitate a policy response.
Across the pond, the Bank of England is anticipated to be the first major central bank to raise interest rates, following the COVID-19 cycle. According to Reuters, some economists expect the first increase to occur in early 2022, which is later than current market expectations. As per the Central Bank of the Russian Federation, Russia’s gold reserves were 73.9 million troy ounces at the start of October.
Paul Tudor Jones Prefers Bitcoin over Gold
The market is comparing gold with the leading cryptocurrency, Bitcoin, suggesting that Bitcoin is a better investment. As we discussed in our Bitcoin price prediction, Paul Tudor Jones prefers Bitcoin over gold.
During the last year, gold has lost 8%, while Bitcoin has risen by 437%.
A weaker dollar supports the bullish trend in gold
A weaker dollar aided gold’s advance into a fourth trading session in London. Soft US industrial production data eased inflation fears and monetary tightening concerns, causing the currency to fall. On the heels of the dismal report, the US Dollar Index plummeted to a three-week low, and bond yields also tumbled.
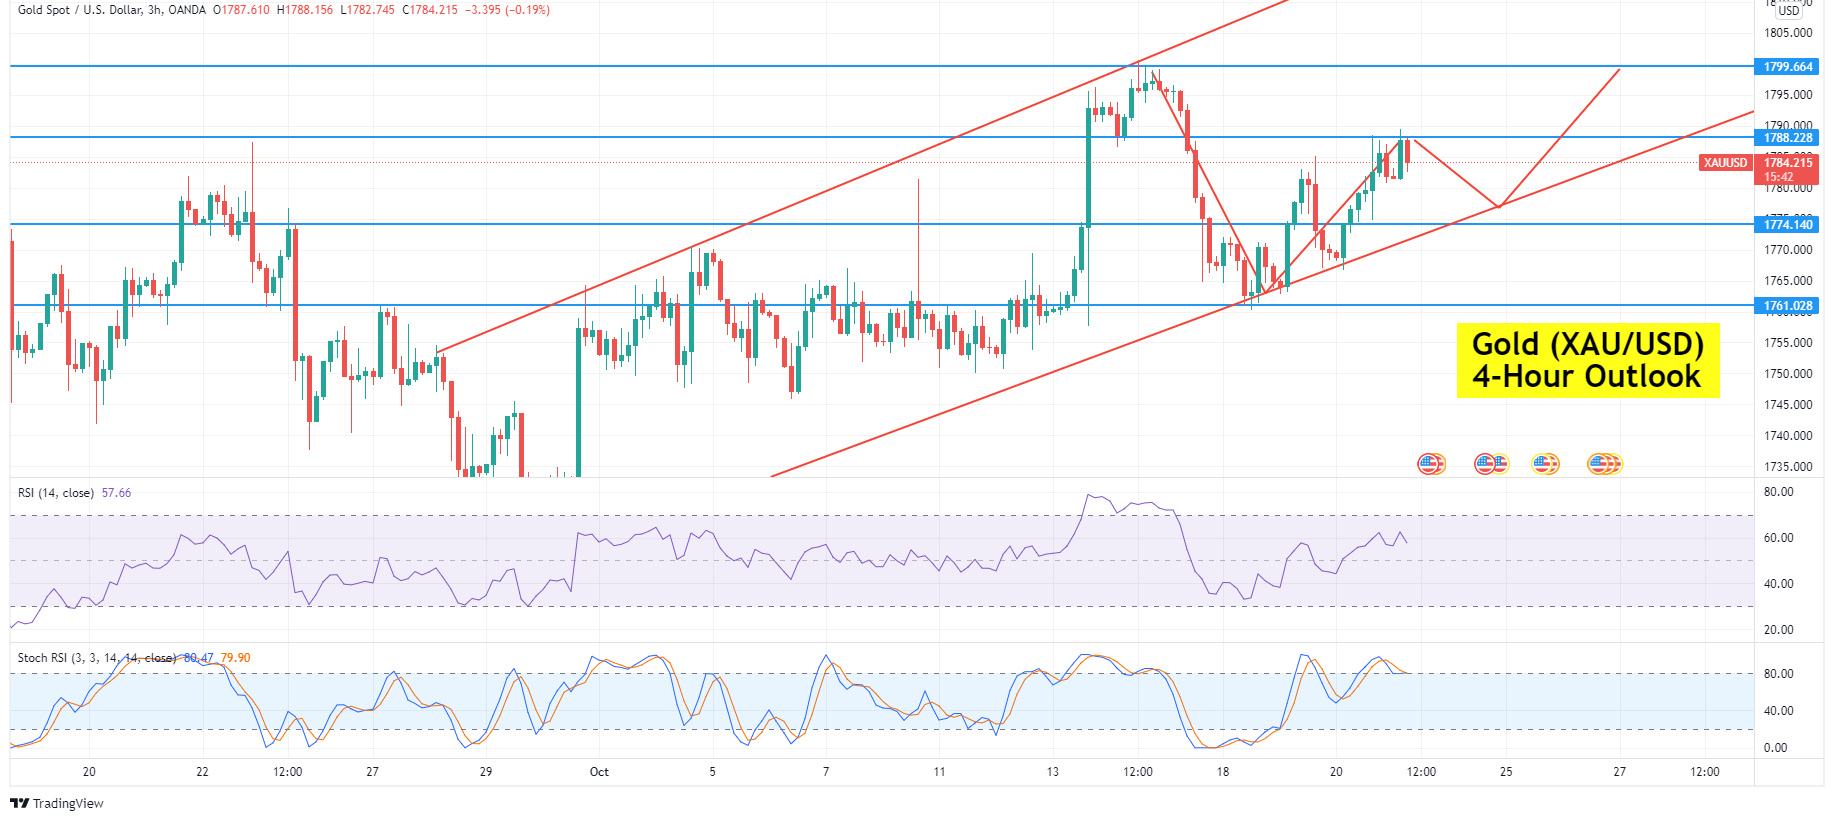
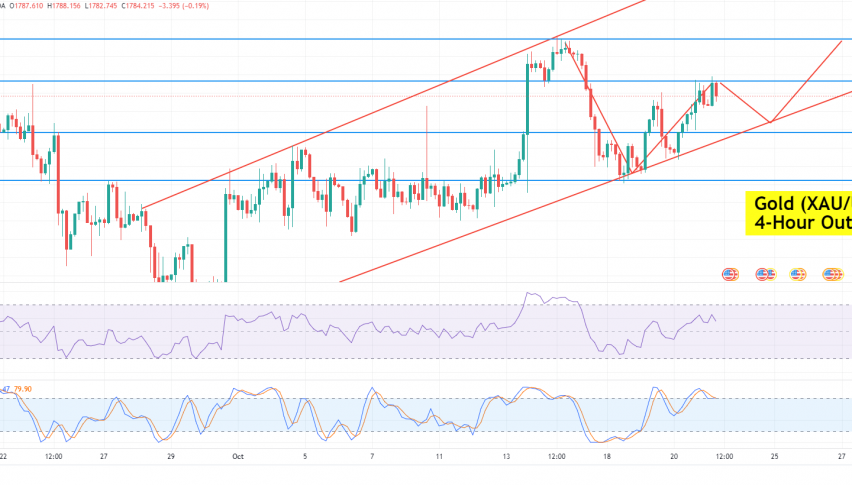
Gold surges to $1,788 – The technical analysis supports buying
The precious metal, gold, is trading with a bullish bias at the 1,788 level. The yellow metal has bounced off the support level of 1,774, which has been extended by an upward channel in the 4-hour timeframe. The closing of candles above the 1,774 level is likely to drive strong buying in gold. On the downside, gold is likely to find immediate support at the 1,769 level. A break below that level could extend the selling trend until the next support level of 1,762.
Conversely, a breakout at the 1,788 resistance level is likely to expose gold prices to the next resistance level of 1,799. On the higher side, additional resistance could be found at the 1,807 level. Let’s consider staying bullish above the 1,788 level today and vice versa. Good luck!