Cardano, Ethereum Price Prediction – ETH Prints New Highs, MAs Keeping ADA Bearish


The situation in the crypto market has changed, after the shuffle on Wednesday, which sent Bitcoin below $60,000. Cryptocurrencies tumbled lower, without much reason. The only reason was some profit-taking after the strong rally in October. But, the decline has stopped and things are starting to look interesting again now, especially for some cryptos.
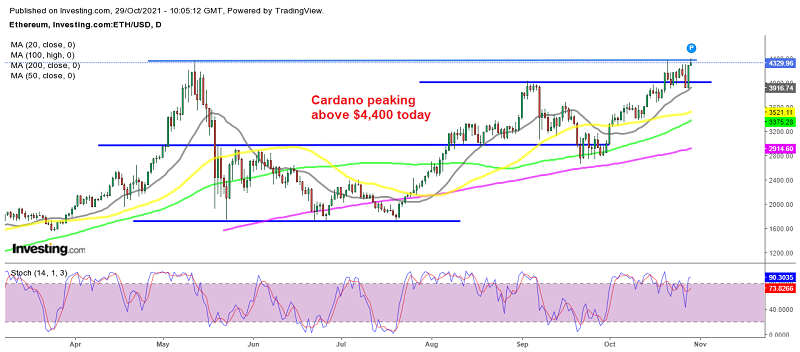
Ethereum Daily Chart Analysis – ETH/USD Breaks Above $4,380
Ethereum has been showing strength in the last few months, brushing off September’s losses and heading for new all-time highs (ATH) at $4,380. It touched that level last week, but buyers got cold feet and left it there. The price started to retreat, and on Wednesday there was a sudden crash in cryptos.
However, the 20 SMA (gray) turned into support and held the decline on the daily chart. ETH/USD bounced off that moving average yesterday, erasing all the losses from the previous days, and today buyers finally pushed the price above the resistance level, reaching a high of $4,400. This once again shows strong buying pressure in Ethereum.
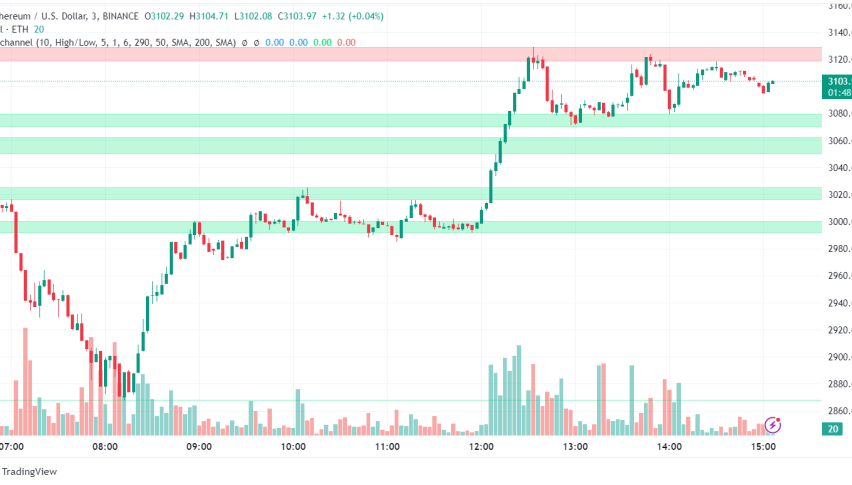
Ethereum H4 Chart Analysis

ETH/USD bounces off the 100 SMA on the H4 chart
Switching to the H4 chart, we see that October has been quite bullish for Ethereum, as it increased from $2,800 to today’s price of $4,400. Moving averages have been doing a great job as support, holding the price during pullbacks lower. The latest pullback ended at the 100 SMA (green) and the price bounced from there. The ETH.2.0 (London hard fork) update is going well, which will be keeping the sentiment bullish for Ethereum, so pullbacks should be seen as good opportunities to go long.
Cardano Daily Chart Analysis – Alonzo Update Not Helping

The 20 SMA has turned into resistance for Cardano now
Cardano is also introducing another era in its network, with the Alonzo update. This hard fork, which makes it possible to build smart contracts and issue crypto signals on Cardano, was introduced on September 12. Now, users can create decentralized finance (DeFi) platforms, NFT applications or stablecoins.
The interest in participating in the Cardano network has increased, but that hasn’t helped the native coin ADA. ADA/USD continues to trend down, with moving averages acting as resistance. The 200 SMA (purple) has been the ultimate resistance for this crypto, while today we see that the 20 SMA (gray) is also providing resistance on the H4 chart. So, unless the price moves above all moving averages, Cardano will remain bearish. We are long on Cardano with a buy ADA/USD signal, so we hope that buyers start taking control of the situation.