Fantom Crypto (FTM), Ethereum (ETH) Dangerous Bearish Breakout
Fantom Crypto FTM and Ethereum ETH looking increasingly bearish today on this decline
Cryptocurrencies were slowly retreating lower in the second half of last week, after posting some new record highs in the first half. But the retreat has accelerated this week, sending Fantom to almost $2 and Ethereum in the direction of $4,000. This bearish wave has broken some important levels/indicators, such as the $60,000 level in Bitcoin, while sending FTM and ETH to the two levels we mentioned above, so let’s have a look at these two cryptocurrencies.
Fantom, Daily Chart Analysis – The First Support has been Broken
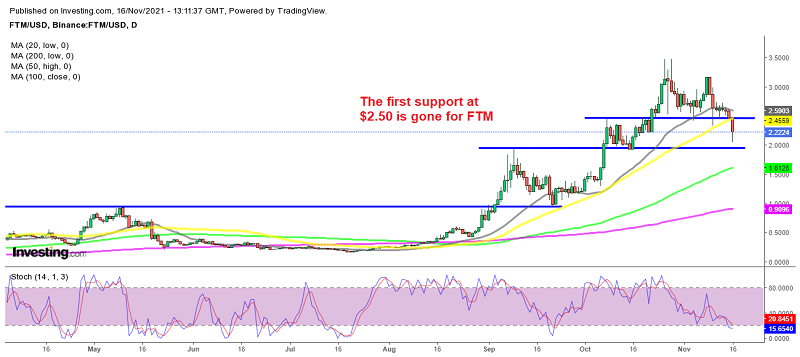
The Fantom coin has been one of the most bullish cryptocurrencies since late August, increasing from around $0.20 to almost $3.50, which means an increase of more than 15 times in value in just a few months. During this time, the 50 SMA (yellow) has done a good job in scaring sellers away during pullbacks, although the support and resistance levels have been more important for FTM/USD.
The interesting pattern for Fantom coin is that the previous highs have been turning into support since May. May’s high, which was under $1, turned into support in September, then September’s high, which was under $2, turned into support in October, and October’s high, at around $2.50, turned into support this month. But, the first support, which is the last month’s high, has been broken, and now the price is heading for the September high.
So, things look bearish for Fantom, which has lost nearly $1.50. But, if the support at $2 holds, we might decide to go long on Fantom, since the Fantom Developer Conference in Abu Dhabi has attracted a lot of attention in the industry, and many new projects are expected to be built on Fantom soon.
Ethereum Daily Chart Analysis – The 50 SMA Holds as Support

Should we buy Ethereum at $4,000?
Ethereum had a nice run during August, increasing from $1,700 to just above $4,000, with the 20 SMA acting as support on the daily chart, which shows the strength of the uptrend. In September, we saw a retreat lower, to under $3,000, but the 50 SMA (yellow) and then the 100 SMA (green) turned into support on the daily chart.
In October, the uptrend picked up pace again, and Ethereum approached $5,000. ETH/USD left the 20 SMA behind, showing that the trend was even stronger than before, but today, the price fell below the 20 SMA, as the US Congress tries to regulate the crypto market, which is both positive and negative, since it brings the market under taxation, but it also shows that the traditional financial industry is accepting cryptocurrencies as part of the industry, instead of trying to kill them, like China is doing. The 50 daily SMA held as support and the stochastic is almost oversold, so the retreat might have come to an end, and we are considering opening a buy Ethereum signal soon.
Ethereum Live Chart
- Check out our free forex signals
- Follow the top economic events on FX Leaders economic calendar
- Trade better, discover more Forex Trading Strategies
- Open a FREE Trading Account
- Read our latest reviews on: Avatrade, Exness, HFM and XM
Related Articles


Sidebar rates
Related Posts
