Solana (SOL), Binance (BNB) – Still Looking Bullish After the Retreat
Solana Daily Chart Analysis – The Rejection off the 20 SMA Looks Weak
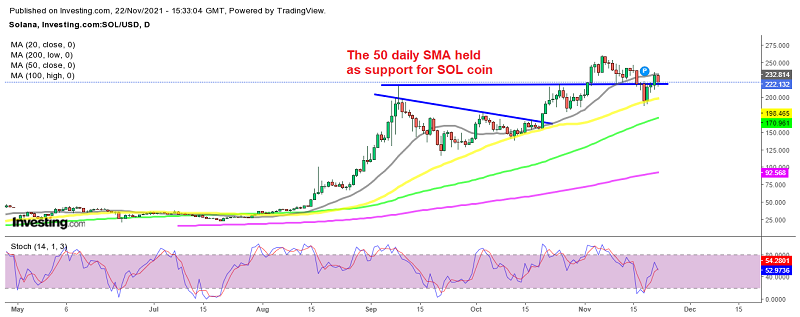
Solana has seen some incredible bullish price action since August, increasing from around $15 to $270. The biggest rally took place in August, while in October SOL/USD was consolidating the gains and forming a triangle. The bottom of the triangle was provided by the 50 SMA (yellow) on the daily chart, which was acting as support.
But, the uptrend resumed again in October and the triangle was broken as we predicted back then and the price continued higher, but in November cryptocurrencies have been mostly on a retreat. The 20 SMA (gray) was acting as support but then it was broken and the 50 SMA took up that job again.
The price bounced nearly $50 higher, but the 20 SMA turned into resistance, although the rejection hasn’t been too strong, so buyers remain in control here and new highs are expected before the end of 2021, since the number of projects on Solana network keeps growing, with Solberg Sale coin going live on Solana, which will enable anyone to access decentralized finance (DeFi) and transition to the Solana blockchain smoothly.
Binance Daily Chart Analysis – BNB Keeps Making Higher Lows

The 50 SMA is pushing the lows higher for Binance
Binance coin hasn’t been as bullish as Solana, which surged around 1,700%, but BNB/USD has been quite bullish nonetheless, increasing from around $260 in August to $670earlier this month. Binance has suffered a number of harsh attacks, such as banning this exchange from a number of countries, cyberwar attacks that led to a temporary shut down, and now customers are have taken legal action against Binance.
Although, it has survived all of this and has been progressing higher, as people and investors realize that the crypto market will be here to stay. The failure to crack it down during this year is a confirmation of this. Last week we did see a sharp pullback, but came from the crypto market which retreated lower and the pullback seems complete after BNB/USD found support at the 50 daily SMA (yellow). The 20 SMA (gray) is acting as resistance at the top, but that will be broken soon, as buyers remain in control here as well.


