Booking Profit in USD/CAD Fast, As Crude Oil Continues the Crash


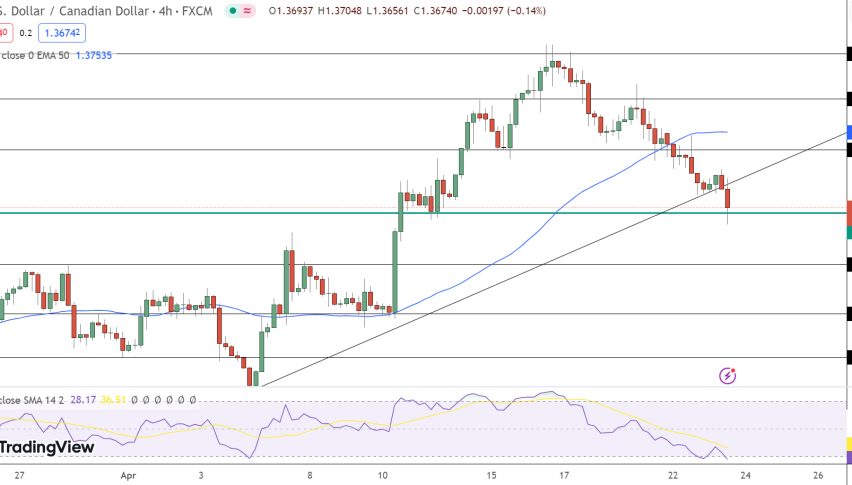
USD/CAD used to be on a strong bearish trend for more than a year, as crude Oil was going up. But, the decline stopped at 1.20 and this pair has been trending higher since then. The USD has turned bullish in itself, as the FED turns hawkish, accepting inflation and starting the tapering process. This week we heard Jerome Powell that he wants to speed up the tapering process since inflation is now widespread, which is more positive news for the USD.
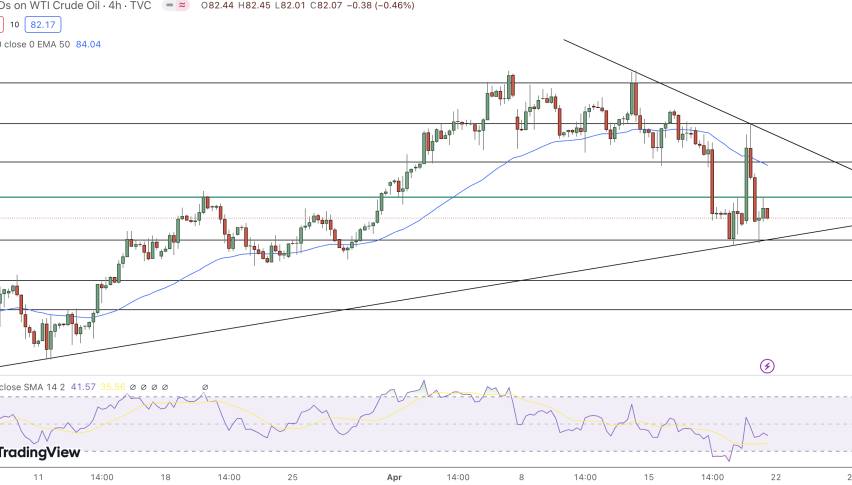
So, USD/CAD continues the bullish trend and the fact that crude Oil is crashing lower is adding more fuel to the uptrend. US WTI retreated from $85 to $62.50 yesterday, so the decline doesn’t seem to stop, despite recuperating somewhat today. USD/CAD retreated lower to the 50 SMA (yellow) on the H4 chart, which has been acting as support recently and we decided to open a buy signal, which closed in profit as the price started to reverse higher again. Meanwhile, we had two important jobs reports from the US and Canada today and the numbers from Canada were great, but they won’t stop the uptrend in USD/CAD .
Canadian Employment Report November 2021:
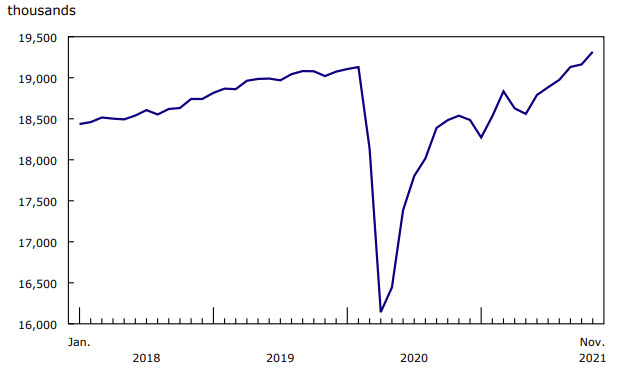
- November employment +153.7K vs +35.0K expected
- October was +31.2K
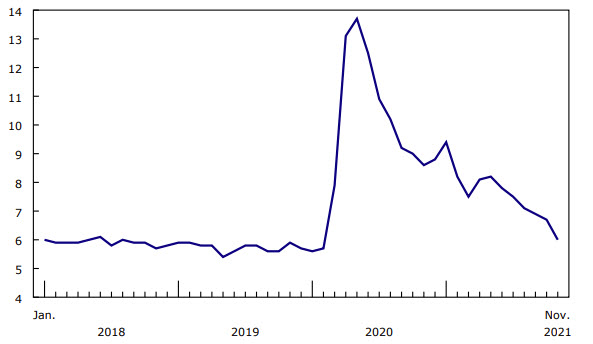
- Unemployment rate 6.0% vs 6.6% expected
- Participation rate 65.3% vs 65.3 prior
- Full time jobs +79.9K vs +36.4K prior
- Part time jobs +73.8K vs -5.2K prior
- Average hourly wages +3.0% y/y vs +2.1% prior
This is a sensational report. USD/CAD has immediately fallen to 1.2775 from 1.2817 but mixed in with that is the impact of the US non-farm payrolls report. The unemployment rate is the lowest since February 2020 and overall jobs are now 186K above pre-pandemic levels.
The Bank of Canada meeting next week will be an interesting one. Without omicron, this would mean signals about a faster pace of rate hikes but the BOC will have to weigh that against virus developments.
US Non-Farm Employment Report November 2021

- November nonfarm payrolls 210K vs 550K estimated
- October payrolls were 531K revised to 546K
- Two month net revision +82K
- Non-Farm Payroll 210K vs 550K estimate
- Unemployment rate 4.2% vs 4.5% estimate. Last month unemployment rate 4.6%
- Participation rate 61.8% vs 61.6% estimate. Last month 61.6%. Prepandemic 63.5%
- Underemployment rate 7.8% vs 8.4% estimate. Last month 8.3%. Prepandemic 7.0%
- Average hourly earnings YoY 4.8% vs 5.0% estimate. Last month 4.9%
- Average hourly earnings MoM 0.3% vs 0.4% estimate.
- Change in manufacturing payrolls 31K vs 50K estimate. Last month +60K.
- Total private jobs 235K
Goods Producing 60K versus 108K last month
- Manufacturing +31K vs 48K last month
- Construction +31K vs 43K last month
- Mining and logging -2K vs +3 K last month
- Trade transportation and utilities 37K
- Information -2K
- Financial activity 13K
- Professional business services +90K
- education and health services plus 4K
- Leisure and hospitality +23K
- Other services +10 K
- Federal + 2K
- State -9K
- Local -18K
Some good and bad in the report. The nonfarm payroll number was obviously much lower than expectations. The two-month revision saw October revised higher by 15K. September was revised higher by 67K for a net two-month revision of +82K.
The unemployment rate declined faster than expectations and the participation rate moved higher as well. The under-employment rate was also lower than expected. Average hourly earnings came in a touch weaker which is a positive for inflation but still remains high at 4.8% year on year. The initial dollar reaction was to the downside but those gains have been reversed.
ISM Services PMI Index for November

- ISM November services PMI index 69.1 points versus 65.0 estimate
- October ISM services were 66.7 points
- New orders 69.7 points versus 64.0 estimate. Last month 69.7 points
- Employment index 56.5 points versus 52.2 estimate. Last month 51.6 points
- Prices paid 82.3 points versus 80.9 estimated. Last month 82.9 points
- Business activity 74.6 points versus 69.8 in October
- Supplier deliveries 75.7 points versus 75.7 last month
- Backlog of orders 65.9 points versus 67.3 last month
- New export orders of 57.9 points versus 62.3 last month
- Imports 50.5 versus 53.3 points last month
- Inventory sentiment 36.4 points versus 37.3 last month
Some highlights:
- The index is the highest reading since the inception of the index in 2008.
- The 12-month average is 62.1 percent, which reflects strong and sustained demand in the services sector.
- The November reading indicates the services sector grew for the 18th consecutive month after two months of contraction and 122 months of growth before that.
Economic activity in the services sector grew in November for the 18th month in a row – with the Services PMI® setting a record for the fifth time in 2021 – say the nation’s purchasing and supply executives in the latest Services ISM Report On Business. In November, the Services PMI® registered another all-time high of 69.1 percent. Demand continues to be strong, reflected by subindex data in November. The Backlog of Orders Index registered 65.9 percent, 1.4 percentage points lower than October’s all-time high reading of 67.3 percent. Services businesses continue to struggle replenishing inventories, as the Inventories Index (48.2 percent, up 6 percentage points from October’s reading of 42.2 percent) and the Inventory Sentiment Index (an all-time low of 36.4 percent, down 0.9 percentage point from the previous month’s figure of 37.3 percent) stayed in contraction or “too low” territory in November. All 18 services industries reporting growth in November – listed in order – are: Real Estate, Rental & Leasing; Transportation & Warehousing; Retail Trade; Agriculture, Forestry, Fishing & Hunting; Management of Companies & Support Services; Utilities; Wholesale Trade; Mining; Public Administration; Construction; Health Care & Social Assistance; Arts, Entertainment & Recreation; Other Services✣; Professional, Scientific & Technical Services; Finance & Insurance; Information; Educational Services; and Accommodation & Food Services.