Decisive Time for Avalanche (AVAX) and Polkadot (DOT) – Time to Turn Bullish?
Will Avalanche AVAX and Polkadot DOT turn bullish at MAs?
Polkadot and Avalanche have been really bullish since August, particularly AVAX, which increased around 15 times in value, as it surged from around $10 to almost $150. Polkadot also had a great run, from $10 to $55 until early November, but both cryptocurrencies have been bearish for more than a month. Now both are facing support zones, so will they bounce off them or continue lower? Let’s see.
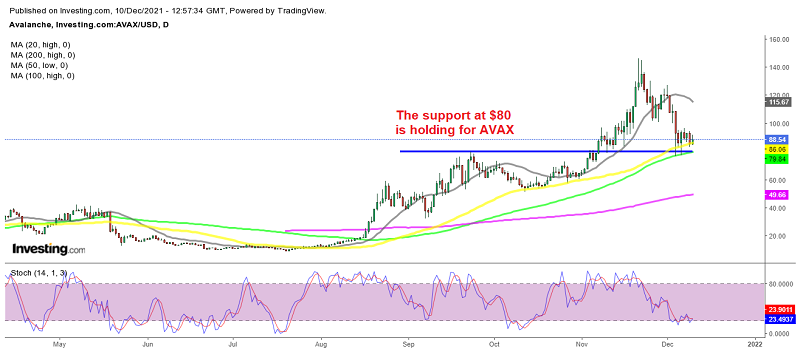
Avalanche Daily Chart Analysis – AVAX Facing the Support at $80
Avalanche turned even more bullish in November, when the cryptocurrency market was reversing lower. It continued increasing until the fourth week of November, reaching a market cap of $30.11 billion. But, in the last three weeks the increasing bearish momentum in the crypto market has pulled AVAX/USD down with it, causing it to lose around half its value, and falling below $80.
But, the previous high at this level has now turned into support, and moving averages are helping to hold this cryptocurrency up. Now, Avalanche is oversold on the daily chart, so once the sentiment turns positive in the crypto market, Avalanche will resume the bullish trend. Avalanche has struck a number of partnerships, as its ecosystem keeps flourishing. A number of non-fungible tokens (NFTs) are sprouting up on the Avalanche blockchain, while the deal with Deloitte was a major one. So, once the sentiment improves, Avalanche will be back up.
Polkadot Daily Chart Analysis – DOT Deciding at the 200 SMA

The 200 SMA is holding as support for now
Polkadot was trading around $5 at the beginning of the year, then it reached $50 by May. The price retreated to $10 during the crash back then, but after a consolidation period around that level, it resumed the uptrend again and pushed to $55 by the beginning of November. The 200 SMA (purple) turned into support in September, holding during the second crash this year and now this moving average might be holding the decline again.
DOT/USD broke below the first support at $50 earlier last month, then it broke the second support at $40 later, and now it is facing the ultimate support below $30, where the 200 SMA stands. Polkadot’s first parachain was won last month, and more parachains will be auctioned, so 2022 will be a good year for Polkadot. But, the support around the 200 SMA will have to hold. If it does, then this might be a good place to buy DOT coins.
Polkadot Coin DOT Live Chart
- Check out our free forex signals
- Follow the top economic events on FX Leaders economic calendar
- Trade better, discover more Forex Trading Strategies
- Open a FREE Trading Account
- Read our latest reviews on: Avatrade, Exness, HFM and XM
Related Articles


Sidebar rates
Related Posts
