Waiting to Buy GBP/USD at the 50 SMA After Impressive UK GDP Report


The GBP/USD has been on a bearish trend since the beginning of summer last year, reversing from 1.4250s, and falling to 1.3150s by early December, as US inflation kept surging and the FED turned hawkish. Although, inflation increased in the UK as well, and the Bank of England also started to turn hawkish, increasing interest rates from 0.10% to 0.25%.
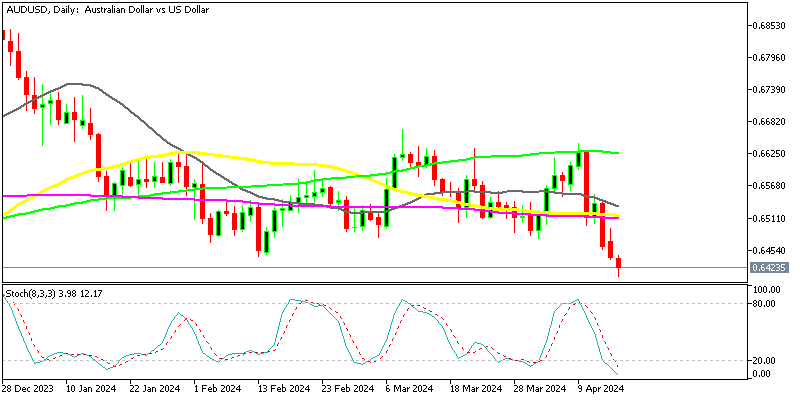
This has helped the GBP, which has turned quite bullish as more tightening is expected to come from the BOE. The GBP/USD has increased to 1.3750s, over the last few weeks, although we are seeing a pullback lower today, as the USD makes some gains. But, we are preparing to buy this pair at the 50 daily SMA (yellow), which has been acting as support recently. Below are both the UK GDP report and the US retail sales report, which came in negative for December.
GBP/UD H4 Chart – The 50 SMA Should Hold if the 20 SMA Breaks

UK November GDP Report
- November monthly GDP +0.9% vs +0.4% expected
- December GDP was +0.1%, revised to 0.2%
- GDP QoQ +1.1% vs +0.8% expected
- Prior GDP QoQ +0.9%

That’s a solid beat, but all this was before the resurgence in COVID-19 cases, due to the rapid spread of the Omicron variant. In any case, the improvement sees the GDP in the UK now at 0.7% above its pre-pandemic level i.e. February 2020. Looking at the details for November, the services output was the main driver, contributing by 0.54%. Meanwhile, production activity rose by 0.13% and construction by 0.21% for the month.
US December Retail Sales Report
- US December retail sales -1.9% vs 0.0% expected
- November sales were +0.3% (revised to +0.2%)
- Core sales ex-autos -2.3% vs +0.2% expected
- Prior core sales were +0.3% (revised to +0.1%)
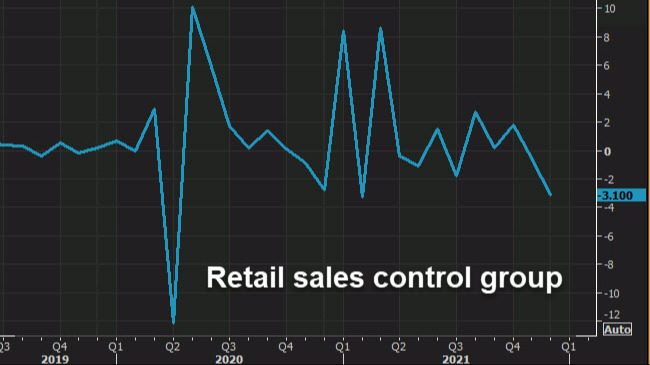
- Control group -3.1% vs +0.1% expected
- Prior control group -0.1% (revised to -0.5%)
There was considerable hand-wringing about a possible soft reading in retail sales, due to credit card spending data, and that indeed proved to be the case. The numbers were even worse than speculated, with the largest fall in the control group — which excludes oil, gas and building materials — since Feb 2021.
I’ve been writing lately about how December retail sales tend to miss because of the secular trend towards earlier holiday shopping, and that was especially true this year, because of worries about shipping. Later, the lack of spending was compounded by Omicron.
Highlights:
- Furniture and home furnishings -5.5%
- Electronics and appliances -2.9%
- Clothing -3.1%
- Non-store retailers (online) -8.7%
- Food services and drinking -0.8%
Some of this hints at an overall normalization in spending. One under-reported story is just how strong retail spending has been, particularly on goods. If you look at the year-over-year numbers compared to last December, it’s illustrative:
- Furniture and home furnishings +11.1%
- Electronics and appliances +14.6%
- Clothing +29.5%
- Non-store retailers (online) +10.7%
- Food services and drinking +41.3%
- Overall retail sales y/y +16.9%
So while this report missed expectations badly, it was still a much better holiday spending season than a year ago. It’s similar — if not stronger — if we aggregate Oct-Dec, with virtually all categories up double digits.
Some of that helps to explain why the market has taken this in its stride. I also strongly suspect that traders were positioned for a negative miss, given the credit card data.