Ripple Price Analysis: Sellers Dominate Under $0.80
After failing to break beyond the $0.8650 level, the ripple price began a new fall against the US dollar. The XRP/USD pair dropped below the
•
Last updated: Monday, January 17, 2022
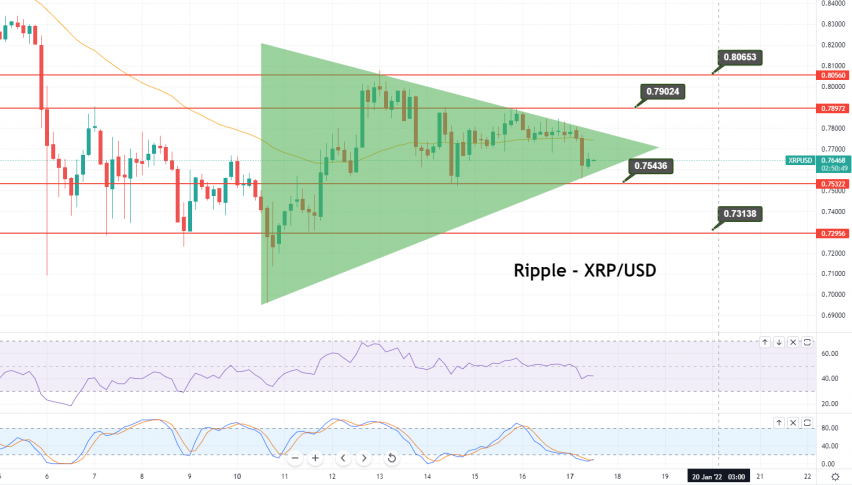
- A close above the $0.8000 level might send the price up to the $0.8500 mark
- Ripple fell rapidly below $0.7500 and the 55-day simple moving average (4-hours)
- According to the chart, the price of Ripple is currently trading below $0.7800 and the 55 simple moving average (4-hour)
Ripple Live Rate
XRP/USD

- Check out our free forex signals
- Follow the top economic events on FX Leaders economic calendar
- Trade better, discover more Forex Trading Strategies
- Open a FREE Trading Account
- Read our latest reviews on: Avatrade, Exness, HFM and XM
ABOUT THE AUTHOR
See More
Arslan Ali Butt
Lead Markets Analyst – Multi-Asset (FX, Commodities, Crypto)
Arslan Ali Butt serves as the Lead Commodities and Indices Analyst, bringing a wealth of expertise to the field. With an MBA in Behavioral Finance and active progress towards a Ph.D., Arslan possesses a deep understanding of market dynamics.
His professional journey includes a significant role as a senior analyst at a leading brokerage firm, complementing his extensive experience as a market analyst and day trader. Adept in educating others, Arslan has a commendable track record as an instructor and public speaker.
His incisive analyses, particularly within the realms of cryptocurrency and forex markets, are showcased across esteemed financial publications such as ForexCrunch, InsideBitcoins, and EconomyWatch, solidifying his reputation in the financial community.
Related Articles
Sidebar rates
Related Posts
