Selling Jump in EUR/GBP Again, After Booking Profit on Yesterday’s Trade


EUR/GBP has been bearish since September of 2020, despite the Eurozone and the UK being affected the same way by coronavirus restrictions, which were similar. Inflation has also been similar in both economic areas, keeping a similar pace as it increases. Although the Bank of England started increasing interest rates in December last year, when we saw a quick flush to 0.82 in this pair.
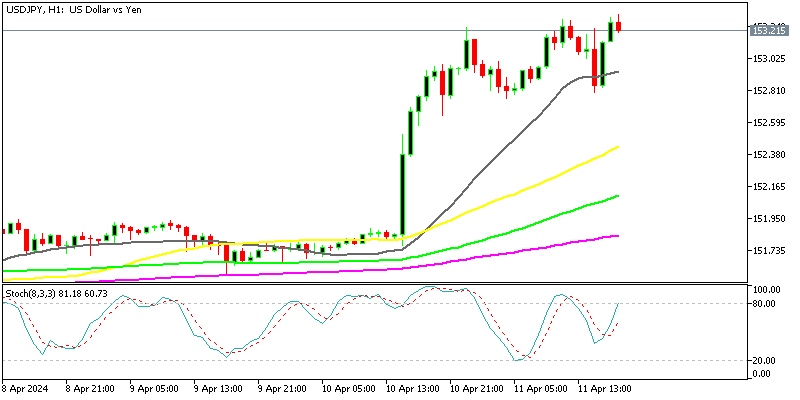
Toward the end of last month, we saw a surge in the Euro which took the price above 0.85 as the sentiment improved and the Euro benefited from that, but the trend reversed again and this pair has been bearish since then, with moving averages acting as resistance on the H1 chart.
The 50 SMA (yellow) was the last one to reject this pair yesterday, where we decided to open a sell signal in EUR/GBP. That forex signal closed in profit and today we decided to use this retrace higher for another sell trade, after the 100 SMA (green0 is rejecting the price again, as shown on the chart above.
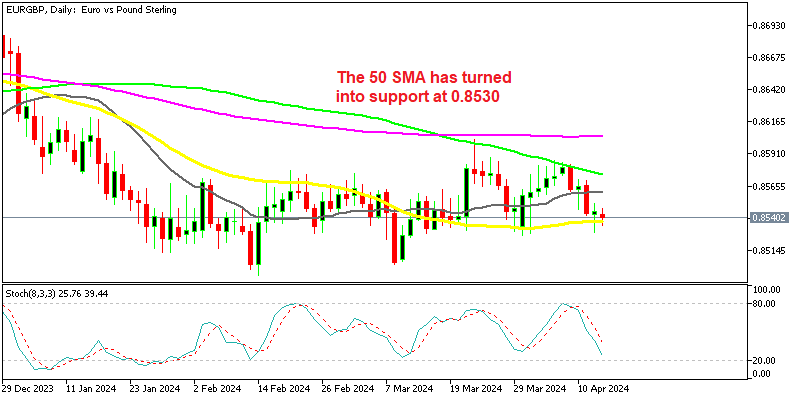
EUR/GBP H4 Chart – The 200 SMA Turns Into Resistance
 Can the 200 SMA hold EUR/GBP down?
 Can the 200 SMA hold EUR/GBP down?
On the H4 chart, we can see the surge at the end of March and the quick reversal this month. with the price falling below the 200 SMA (purple). This moving average stopped the climb higher earlier today, so it might be turning into resistance on this timeframe.