Ethereum Price Prediction – Why ETH Can Struggle Under Double Top $1,275


Ethereum has dropped more than 8% in the last 24 hours as the crypto bloodbath continues. Bears are in charge of the market as the coin approaches the $1000 price. The massive sell-off has also significantly impacted Bitcoin, which has lost over 33% in the last week alone. Other market movers have also seen significant drops in their respective charts due to this.
ETHEREUM has lost support at $1300 and is now aiming for $1000. Buyers have left the market as the coin has remained highly oversold. In the last 24 hours, the global cryptocurrency market cap has fallen 3.7 percent to $950 billion. The coin’s trading volume also increased significantly on the previous day.
Ethereum has experienced significant volatility over the last few days, trading between $1600 and $1200. However, if the market sell-off continues, ETH may not see a price correction in the coming trading sessions.
On the one-day chart, ETH was trading at $1122. The coin last traded at or near this level in late January 2021. In the past, this point for the coin triggered a rally in which the coin soared and traded above $4000.
The sellers’ pull could drag Ethereum below the $1000 price level. The coin’s immediate price support level was $1014. The volume traded was red, indicating that the market was under bearish control. The coin encountered resistance at $1271 and then at $1600. A surge of buyers could propel ETH back to $1200.
Ethereum Technical Outlook
The selling strength increased dramatically after the coin plummeted. The Relative Strength Index also hit its lowest point of the year, which shows that the market is still heavily sold. The RSI was parked below the 20-point mark, indicating that sellers had taken control of the market. Typically, a price correction follows a significant sell-off.
Other technical indicators on the charts, however, continue to point to bearish price action, making it difficult to predict when and how soon ETH will bottom out. In the same way, the price of ETH was below the 20-SMA, which showed that the market favored sellers, who were driving price momentum.
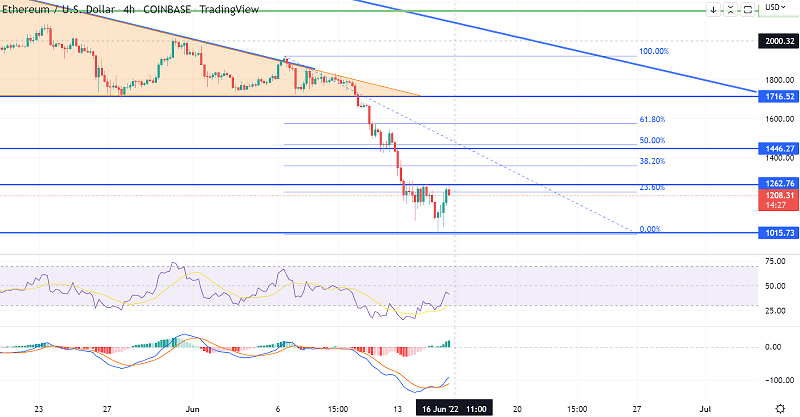
Moving Average Convergence Divergence, like the other indicators, showed a negative reading. The MACD indicator depicts price momentum and change. The indicator displayed red histograms after a bearish crossover. ETH/USD is now facing immediate resistance at 1,260; above this, the next resistance stays at 1,445. At the same time, the support continues to remain at 1,015. Good luck!