Polygon On Fire – Why is $1 Super Important for MATIC Traders?
Polygon (MATIC) has risen dramatically in the last 24 hours, bringing the asset's price near the dollar threshold. However, it has
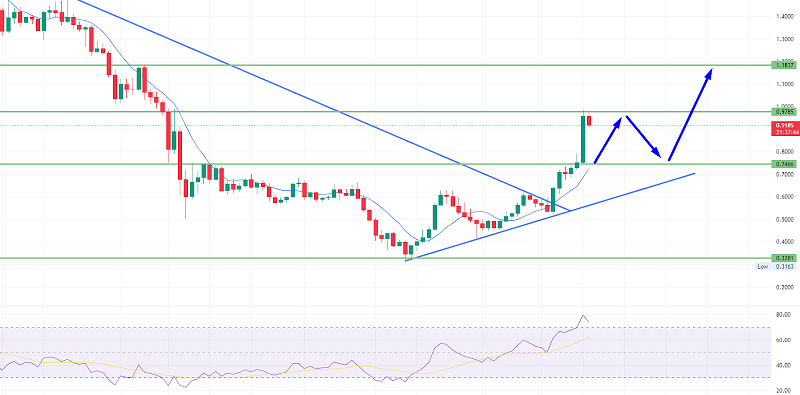
Polygon (MATIC) has risen dramatically in the last 24 hours, bringing the asset’s price near the dollar threshold. However, it has significantly increased after following the route of an upward trendline. As a result, MATIC/USD has maintained its bullish price trend for the past week, resulting in double-digit gains.
The altcoin has broken through numerous key resistance levels and is presently trading above the $0.77 support level. Pullbacks are possible, as the coin has been relatively hopeful in the last week. BITCOIN recently crossed the $22,000 mark, sending major cryptocurrencies higher.
Buyers’ faith in the coin has restored the bulls’ grip on the altcoin. At the time of writing, MATIC was overpriced. On the four-hour chart, the technical prognosis for the coin remained optimistic. The altcoin has continued to create higher highs on the chart, indicating bullish strength. If the bulls keep up the market momentum they have now, MATIC will soon reach the dollar mark again.
On the 4-hour chart, the altcoin was trading at $0.903. MATIC was on the verge of returning to $1.00. If purchasers maintain their pace, MATIC will continue to rise. The coin’s overhead resistance was $1.00.
MATIC/USD Technical Outlook
The MATIC coin was trading at $0.77, followed by $0.68. The altcoin has maintained a higher trajectory, resulting in a positive chart picture. The amount of MATIC traded has recently surged, indicating growing bullish vigor.
The asset registered surplus buying strength as buying momentum strengthened. The four-hour chart showed the same indicators. In addition, the Relative Strength Index has recently entered the overpriced territory.
At the time of publication, the RSI was in the overbought zone. A retreat usually occurs when an asset enters the overbought zone. The price of MATIC was also significantly higher than the 20-SMA line, indicating that buyers are pushing the market’s upward momentum. This is a very bullish sign when the price goes above the 50-day and 200-day simple moving averages.
The altcoin displayed purchase indications on the chart, which were taken into account by the other indicators. The RSI indicator is above 50, signifying a bullish bias among investors.
On the higher side, a breakout of $1 can trigger a sharp buy until the next resistance level of $1.1837. At the same time, the support continues to hold at around $0.7466. A break below this support level may allow for further selling until $0.6060. Good luck!
- Check out our free forex signals
- Follow the top economic events on FX Leaders economic calendar
- Trade better, discover more Forex Trading Strategies
- Open a FREE Trading Account
- Read our latest reviews on: Avatrade, Exness, HFM and XM
Related Articles


Sidebar rates
Related Posts
