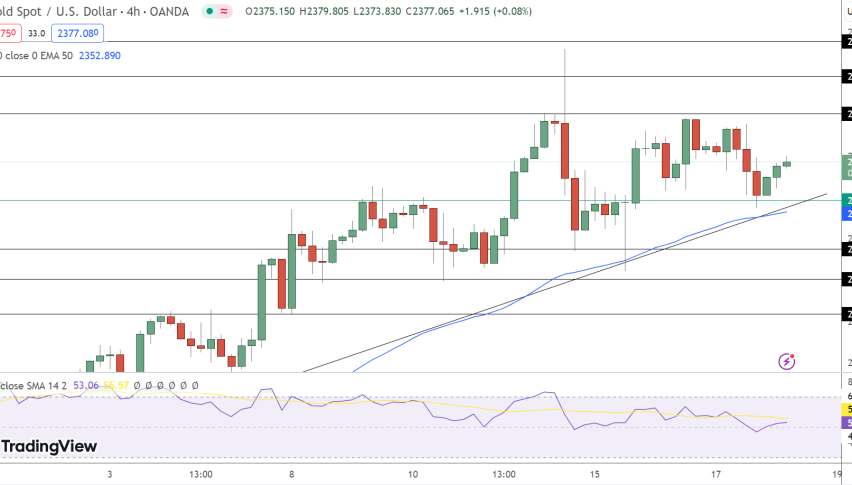
Buying Gold as the 50 SMA Still Holds It Bullish After the Spike


Gold turned bearish since March after failing to hold on above that major resistance zone, but it has reversed in the last few weeks and has made some strong gains. Although, Gold’s new bullish momentum seems to be more than just a technical move; the ability to break above resistance zones and hold and hold above them, could indicate a longer-term fundamental shift.
The major factor which has been fuelling Gold since early November has been the shifting of investor expectations regarding FED’s monetary policy. Although the Federal Reserve is still expected to continue to raise interest rates through the early part of 2023, the pace is expected to slow down.
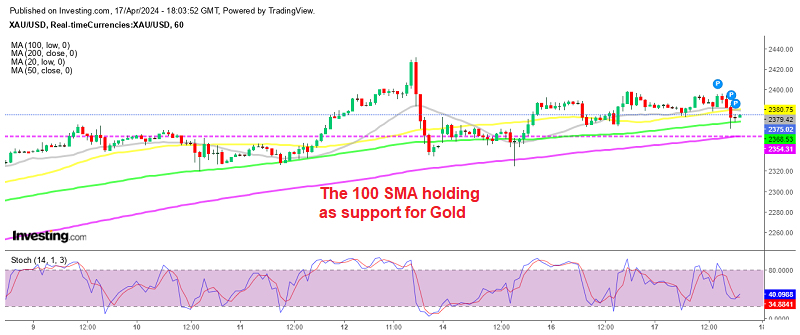
Gold H1 Chart – The 50 SMA Holding As Support Since the Reversal

XAU/USD is oversold on the H1 chart now
This has helped improve the sentiment for GOLD which has totally lost its safe haven status now. Earlier today we saw another spike higher which sent the price to $1,786 after the US producer inflation PPI (producer price index) posted a slowdown, with the annualized number falling from 8.5% in September to 8.0% in October.
The dollar fell upwards of 60 pips across the board when the October producer price index was at 8.0% compared to 8.3% expected. It was seen as another sign that inflation has peaked and that the Fed needn’t raise rates much above 5%. It’s rare for the PPI report to move markets at all, especially when it comes after the CPI report. This just goes to show how focused the market is on economic data. That focus isn’t going to change as both the market and the Fed tries to figure out where growth and inflation are going.