Forex Signals Brief for December 9: US Producer Inflation and China CPI, PPI


Yesterday’s Market Wrap
Yesterday the economic calendar was light with only the US unemployment claims as the main event, which came as expected at 230K. The USD was steadily sold throughout the day as the market shows increasing concerns about the health of the US economy. However, the USD weakness wasn’t a uniform driver across markets as stocks traded sideways.
Most major currencies ended up higher against the USD at the end of the day, apart from the Canadian Dollar. USD/CAD fell on what was initially a jump in crude Oil prices on the news that the Keystone pipeline was shut down due to a leak across the line, but even as Oil reversed lower again but the CAD held onto gains, mostly due to the USD weakness. The BOC member Kozicki didn’t rule out further rate hikes which should have helped the CAD too.
Today’s Market Expectations
Today started with the Consumer inflation in China CPI (consumer price index) which cooled off further despite being quite low, while the producer inflation PPI (producer price index) declined instead. The consumer inflation expectations from the UK will be released soon, while later in the day we have some decent economic releases from the US. The headline PPI producer inflation is expected to be unchanged at 0.2%, but the core PPI is expected to increase by 2 points. This isn’t usually a market mover but last month we saw a huge move on the PPI report at a time when inflation numbers mean everything, so the figures today might be a big one before next Wednesday’s CPI report.
Forex Signals Update
Yesterday we continued the positive strike with trading signals, despite the volatility being quite low. Although there were some nice moves enough to pick several trades. We opened four forex signals against the USD apart form the USD/CAD signal, all of which closed in profit.
Buying AUD/USD
AUD/USD has been bullish since the middle of October, as the FED prepares to slow down with rate hikes, which has improved the sentiment for risk currencies, while hurting the USD. The uptrend has been consistent and moving averages have acted as support on the H4 chart, so we decided to open a buy USD/USD signal yesterday after the retreat, which closed in profit after the upside momentum resumed.

AUD/USD – 240 minute chart
Buying the Retreat at the 100 SMA in USD/CAD
USD/CAD popped above 1.37 on Wednesday and then retreated lower, but the 50 SMA (yellow) turned into support and the price bounced back up from there. Yesterday we are seeing another pullback lower as the USD weakness resumes, but another moving average is acting as support now. The price formed a couple of doji candlesticks at the 100 SMA which are bullish reversing signals after the pullback, so we decided to open a buy USD/CAD signal here, hoping for another bounce.

USD/CAD – H4 chart
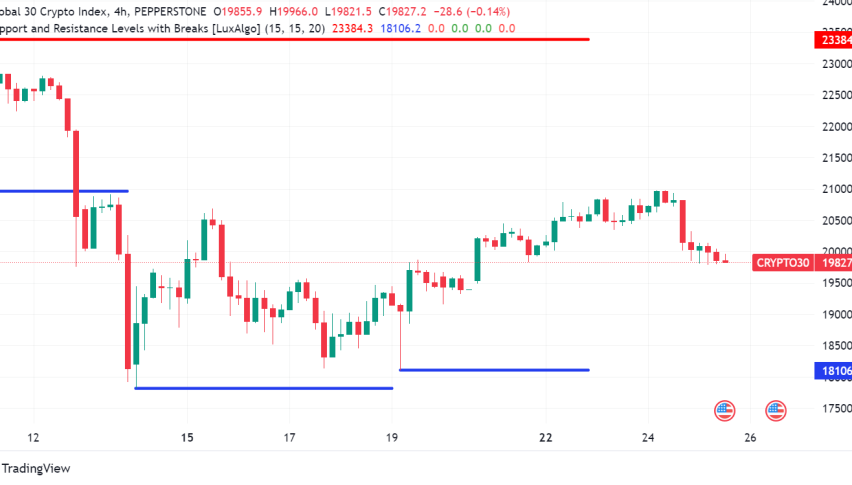
Cryptocurrency Update
Cryptocurrencies have calmed down after the crash following the FTX bankruptcy and have regained the status of risk assets again. They have been crawling higher since the middle of November and after a pullback last week as a result of the USD gaining some momentum, they have turned bullish again this week.
BITCOIN Remains Supported by the 50 SMA
Bitcoin has been trying to make higher highs since forming a support zone around $15,600 where it started bouncing from. Last week we saw a rejection at the 200 SMA (purple) which still remained as the last man standing and stopped the bullish momentum. But, the 100 SMA (green) turned into support and yesterday buyers pushed above this moving average after the bounce higher as risk sentiment improved.

BTC/USD – 240 minute chart
ETHEREUM Still Knocking at the 50 SMA
Ethereum has been making lower highs instead since the crash in early November in the crypto market and the last attempt to turn bullish ended at the 200 SMA (purple) on the daily chart. Although a support area has formed above $1,000 and buyers have been trying to push the price above the 50 SMA (yellow) which they should soon.