WTI Oil Facing the 200 SMA Below $80 on Bullish Momentum After Larger EIA Inventory Drawdown


Crude Oil has been feeling the pressure from central banks raising interest rates pretty fast this year and it reversed down in June, falling to $70 lows about two weeks ago. Central banks are slowing down now and they have softened the rhetoric, which has helped the sentiment improve, although most markets remain uncertain as a deep global recession remains well on the cards.
Bloomberg released a poll of economists yesterday which showed that the odds of a recession have gone up to 70% from 65% in November. As the FED adds to the restrictive policy and raises the terminal rate, it pushes the market toward the recession scenario.
US WTI crude reversed higher but the surge stopped at the 100 SMA (green) on the H4 chart. The 50 SMA (yellow) turned into support for some time and now the price has pushed above the 100 SMA after the jump this week. Yesterday’s large drawdown in the EIA inventories helped crude Oil maintain the bullish momentum, while most other assets traded in a range.
WTI Oil H4 Chart – The 100 SMA Has Been Broken

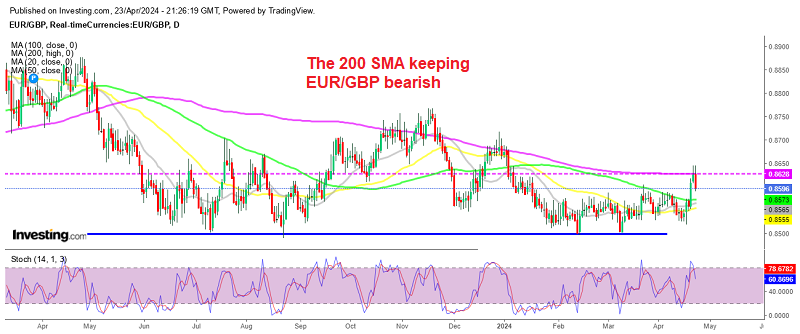
US Crude Oil will face the 200 SMA above
EIA Weekly Inventories
- US weekly EIA oil inventories -5894K vs -1657K expected
- Last week’s inventories were was +10.231K
- Gasoline +2530K vs +2140K expected
- Distillates -242K vs +336K expected
- Refinery utilization vs -0.1% expected
- SPR -3.7m barrels
- Implied demand 20.924 mbpd
Private API data released late yesterday offers a hint on how expectations shifted late:
- Oil -3069K
- Gasoline +4510K
- Distillates +830K
The US has done a remarkable job ramping up product supplies to thwart what looked to be a problematic winter shortage, but the Oil side could get interesting next year again as SPR sales finally end (and buying begins). At the moment, the sentiment remains positive for crude Oil so we will try to buy pullbacks lower.
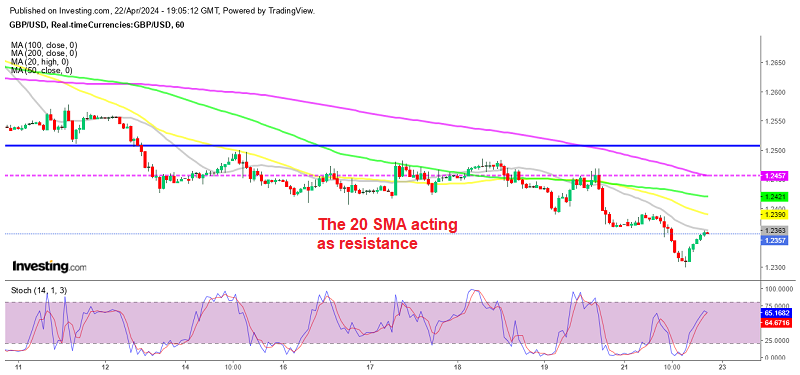
WTI Oil H1 Chart – The 20 SMA Acting As Support

The retrace seems enough for buyers to come back in
The upside momentum in crude Oil picked up further pace since yesterday and the 20 SMA (gray) is acting as support on the H1 chart. The price bounced off that moving average earlier today in late Asian session but has returned back after the upward revision in the US Q3 GDP figures. So we decided to open a buy Oil signal at this moving average and we’re hoping for a bounce, since a better US economy means higher demand for Oil.