Is the Bullish Retrace Over at the 50 Daily SMA for EUR/USD?


Last week, the EUR/USD currency pair showed an interesting price action, hitting a low of 1.05330s early in the week and a high of 1.06920 on Wednesday. Although we saw some retreat, this pair closed the week on a positive note at around 1.0630s, but there are still concerns surrounding the pair.
This week, traders are expecting some increased volatility in the USD due to Jerome Powell’s testimony on Tuesday and the NFP report on Friday. Expectations are that his testimony is hawkish, but on the other hand, Germany’s CPI numbers from last week showed stubborn prices in Europe.
The ECB President Christine Lagarde is set to speak tomorrow, but she may not reveal much about European Central Bank policy. So, despite the positive finish on Friday, traders should be cautious before making any bullish trades on the EUR/USD , with choppy price action due to the upcoming job and wages data.
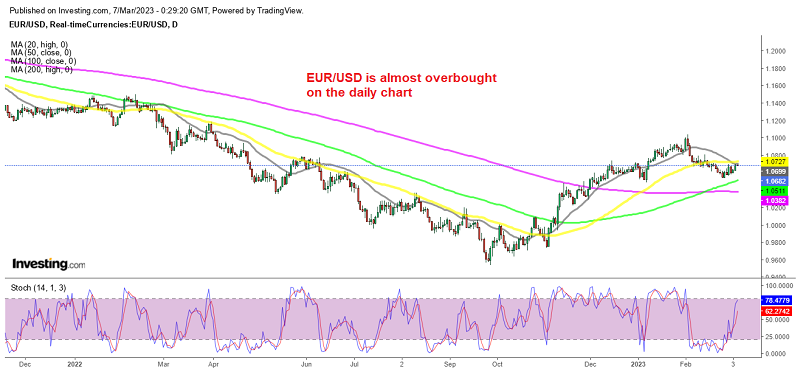
On the daily chart above, we see that moving averages have been doing a great job acting as support during a bullish period and as resistance during bearish periods. This pair has been bullish since October and the 20 SMA (gray) was doing a great job as support, indicating that the bullish pressure was strong.
But, it was broken as USD buyers returned and now the price is facing this moving average and the 50 SMA (yellow) after yesterday’s retrace higher. This might actually be the end of the retrace, since the stochastic indicator is also becoming overbought on the daily timeframe chart. Although, the ECB continues to make hawkish remarks, so the deciding factor will be which central bank will be more hawkish. Below are the comments from ECB’s Lane:
Remarks by ECB Chief Economist, Philip Lane
- Hiking rates beyond March fits with what inflation pressures are suggesting
- Stronger pressures in inflation are indicated by food-related costs and labour market developments
- Weaker pressures instead are arising from energy commodities, economic activity and supply-side bottlenecks
- Heatmap suggests inflation pressures are still strong but there are some emerging signs of easing
He adds that they would have to mark the latest wage developments as a high priority. Well, the headline while significant already fits with what markets are expecting i.e. more rate hikes by the ECB to follow. The question now is whether or not policymakers will make any firm “commitment” after the March meeting.