Forex Signals Brief for March 31: Will Eurozone Inflation Disappoint Today?


Yesterday’s Market Wrap
This week’s theme of better risk sentiment and a retreating USD continued yesterday as well, as risk assets kept climbing higher. There were few significant headlines, as attention remained focused on inflation numbers from German states and Spain, but to a lesser degree on the US Q4 GDP as well. Initial reports caused a decline in bond yields, as the annual inflation rates were lower than in February in Spain and some German states
However, we should note that these figures are subject to a significant caveat. The base effects adjustment to the readings seen in March this year is due to the spike in Oil prices in March last year, caused by the Russia-Ukraine conflict. So, although the headline annual inflation may be lower, the core reading remains high. Anyway, the decline in the German CPI was smaller than anticipated, with the headline CPI YoY coming in at 7.4% against 7.3% expected. that sent EUR/USD 100 pips higher and the USD lower, and the revision lower to 2.6% from 2.7% in the US Q4 GDP weighed further, with spending also revised lower to 1.0% from 1.4% previously.
Today’s Market Expectations
Today started with the manufacturing and non-manufacturing PMI reports from China, which showed a slowdown in activity in both sectors, although they remain in expansion. The Eurozone CPI Flash Estimate for March will be released shortly, with the headline CPI expected to fall from 8.5% to 7.1%, although after yesterday’s numbers from Germany we might see another miss. Core inflation is expected to tick higher though, to 5.8%. Later in the US session we have the Canadian GDP for January, followed by the US PCE Price Index and the UoM Consumer Sentiment.
Forex Signals Update
Yesterday the volatility picked up somewhat after a quiet week, although the direction was clear in favour of risk assets and against the USD. We opened seven trading signals, six of which closed in profit as the USD kept declining, while the EUR/GBP sell signal closed in loss after the jump in the Euro following the German CPI numbers.
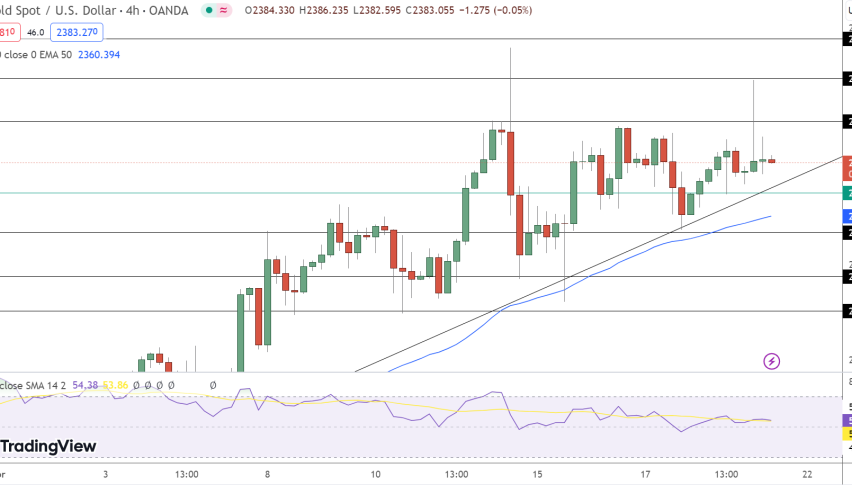
GOLD Resuming the Uptrend Again
Gold has been bullish since the second week of March as the banking crisis sent jitters in financial markets, driving investors into safe havens. We saw XAU move above $2,000 but retreated back down last week after failing to hold gains above that major level. Although the 50 SMA (yellow) held as support on the H4 chart, despite being pierced a few times and pour buy Gold signal closed in profit as buyers moved in.

XAU/USD – 240 minute chart
Booking Profit in WTI Oil
WTI crude Oil turned bullish this week, moving above $70, as risk sentiment turned positive, with the EIA crude reserves showing a major drawdown this week as well. Although the price retreated lower on Wednesday and we decided to open a buy Oil signal at the 20 SMA (gray) where Oil found support. Yesterday the price bounced off this moving average and our signal closed in profit.

US Oil – 240 minute chart
Cryptocurrency Update
Cryptocurrencies have shown a resurgence in buying pressure after a temporary retreat earlier in the week. Despite the lawsuit from the CFTC against Binance and its founder, Changpeng Zhao, the market was largely unaffected, and yesterday, prices were once again heading towards the highs of the year, with Bitcoin breaching $29,000.
BITCOIN Breaks the $29,000 Level
Bitcoin continues to be supported by moving averages, despite the uptrend losing its pace. The 20 SMA (gray) was providing support when the pace was very strong, then the 50 SMA (yellow) held as support for some time and this week the 100 SMA (green) came into play. The price bounced off that moving average and BTC moved above $29,000 yesterday but it retreated lower eventually and is trading above $28,000 again.

BTC/USD – 240 minute chart
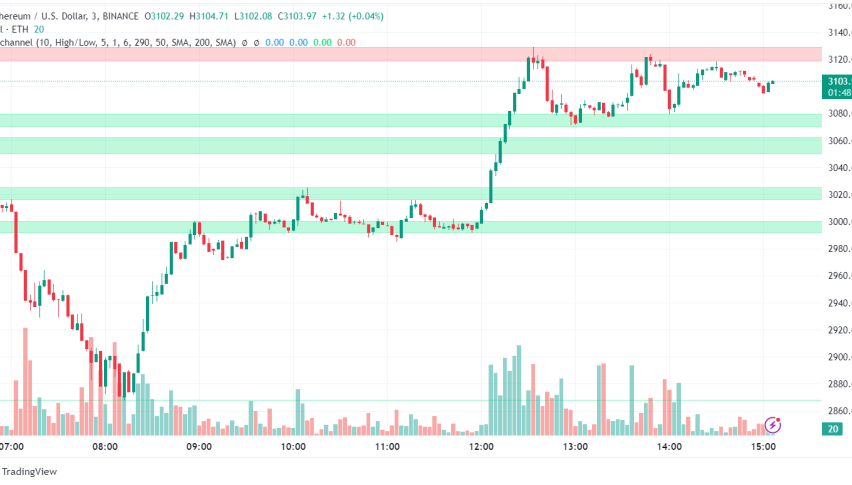
The Support Held in ETHEREUM
Ethereum experienced some bullish momentum as it pushed above moving averages, which later turned into support on the H4 chart. The 50 SMA (yellow) became support that prevented ETH/USD from dropping too low, but eventually it fell below the 100 SMA (green) yesterday, although the support zone around $1,700 held initially.