USD Completes Another Leg Down After Softer PPI Numbers


The USD has been on a bearish trend since October last year, with a pause in February as the economic data appeared to show a bounce in the US economy. But, with the banking crisis, the weaker economy, and the softer inflation numbers, the USD has resumed the decline again since early March. This week markets were focused more on the inflation data, and yesterday the USD resumed the decline as annualized inflation posted a slowdown to 5.0% in March, from 6.0% in February.
Yesterday’s consumer inflation CPI report showed a drop in headline CPI inflation, which was viewed positively by the markets. However, the rise in core CPI inflation highlights the ongoing challenge of controlling rising prices, but markets largely ignored it. Despite the FED’s announcement that there will be no rate cuts in 2023, market expectations suggest another 25 bps hike before the cuts take effect later in the year. The recent banking turmoil has largely subsided, but there is still concern about inflation and its impact on the economy.
Today the attention shifted to the US PPI (producer price index) inflation, which is another measure of inflation. PPI posted a decline instead today, which started another round of USD selling. Additionally, the increase in initial jobless claims helped accelerate the USD decline further, and EUR/USD jumped above 1.1050.
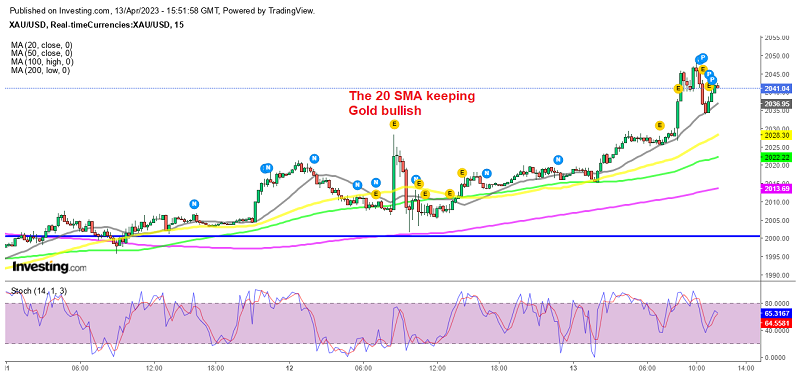
EUR/JPY retreated lower instead, as the JPY benefited from a weaker dollar and safe haven demand. but we decided to open a buy EUR/JPY signal after the retreat stalled at moving averages for this pair. Gold approached $2,050 and we already had two winning Gold signals today. We opened another one after a slight retreat lower.
US March Producer Price Index Report

- March PPI MoM -0.5% vs 0.0% expected
- PPI final demand YoY +2.7% vs +3.0% expected
- Prior PPI YoY was +4.6%
- PPI final demand prices MoM -0.5% vs 0.0% expected
Core PPI ex. food and energy:
- Core PPI YoY +3.4% vs +3.4% expected (prior +4.4%)
- Core PPI MoM -0.1% vs +0.3% expected (prior 0.0%)