Core Inflation Starting to Fall in Europe
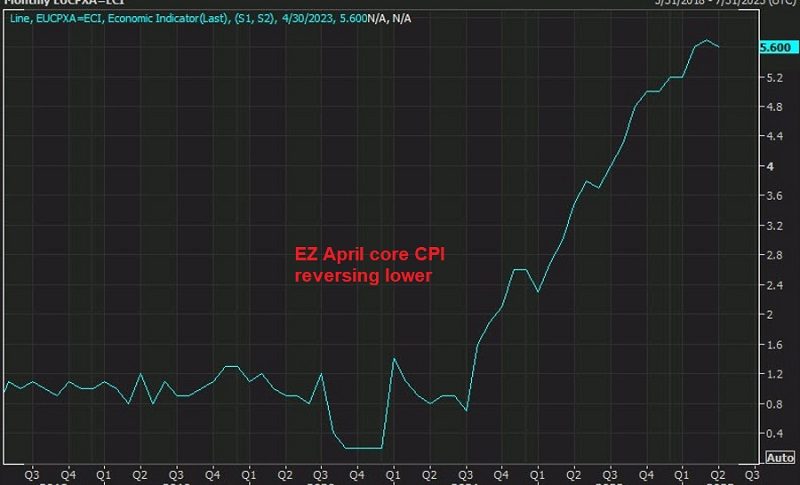
Headline inflation ticked higher in April in the Eurozone, but core inflation which is more important ticked lower to 5.6%

EUR/USD has been bullish since the middle of March, after it rebounded from the support zone at 1.0520-30. Moving averages such as the 50 SMA (yellow) and the 100 SMA (green) has been acting as support on the H4 chart. The price broke above 1.10 by the middle of April and it almost reachd 1.11 last week, before the reversal down following the jump in US GDP price index.
Yesterday EUR/USD moved above 1.10 again as the US Dollar weakened furing thjje European session on this liquidity, but retreated to to a level of 1.0966 as USD buyers regained confidence after the higher ISM manufacturing prices. The pair ended last week at 1.1015, with volatility increasing due to hotter-than-expected US inflation figures released towards the end of the month. The price continued to hoover aorund these levels as we awaitied the European CPI inflation report which was released earlier today.
Eurozone CPI Inflation Report from Eurostat – 2 May 2023
EUR/USD Live Chart
- Check out our free forex signals
- Follow the top economic events on FX Leaders economic calendar
- Trade better, discover more Forex Trading Strategies
- Open a FREE Trading Account


