Can GBP/USD Resume the Bullish Trend This Week?


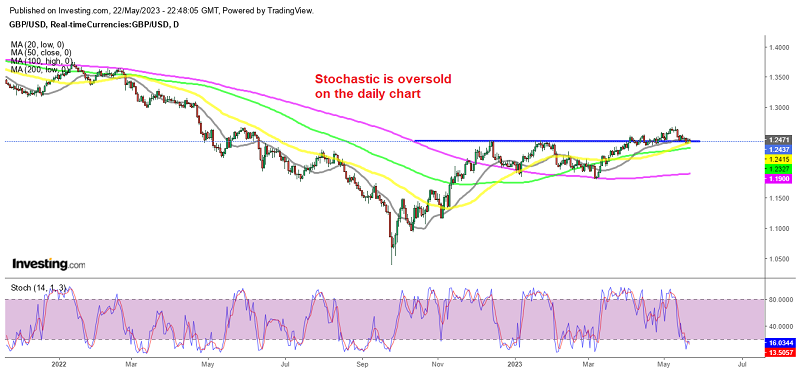
GBP/USD since late September last year after the crash that month, which ended after intevention by UK authorities. This pair broke above moving averages which then turned into support, especially the 200 SMA (purple) which held twice after the rejection at 1.2450s. GBP/USD resumed the bullish trend and pushed to 1.2670.
But in the last two weeks we have seen a bearish reversal as the USD has revived again on comments for further rate hikes by FED members. Although, it seems like the 50 SMA (yellow) held the decline, which shows that it might turned into a support on the daily chart. In the last week or so, the volatility has decliond for this pair, although we might get some decent action this week, after the UK inflation rate which is scheduled for Wednesday. If the actual inflation rate is lower than expectations, it could lead to a dovish shift in the Bank of England’s interest rate expectations. This could have a negative impact on the value of the British Pound (GBP).
According to a Reuters poll, the annualized UK Consumer Price Index (CPI) is predicted to decrease to 8.3% from March’s figure of 10.1%. Lower inflation than anticipated could influence the market perception that the Bank of England may delay or reconsider its plan to raise interest rates. Currently, money markets are indicating an 80% probability of the Bank of England raising interest rates by 25 bps to 4.75% in June, and a 79% chance of a 5% terminal BOE rate by September.
Recent data from the Commodity Futures Trading Commission (CFTC) showed that speculative traders’ net long positions on GBP reached an 18-month high during the week ending May 16. This period coincided with GBP/USD reaching a 54-week high of 1.2679, following softer-than-expected U.S. CPI data on May 10. Speculative traders have maintained a net long position on GBP since mid-April.
When positions reach such highs and are predominantly long (indicating more buyers than sellers), there is a risk of a downside move if the data does not support the existing net position. Given the current positioning at 18-month highs and the predominantly long position, the risk appears to be biased towards the downside for the British Pound. Please note that market conditions can change rapidly, and it’s always recommended to stay updated with the latest financial information and analysis when making trading decisions.