Oil Makes New Highs for 2023 After the Retreat
Crude Oil gained around $2 yesterday after a major decline in EIA inventories and it is heading for the early August highs

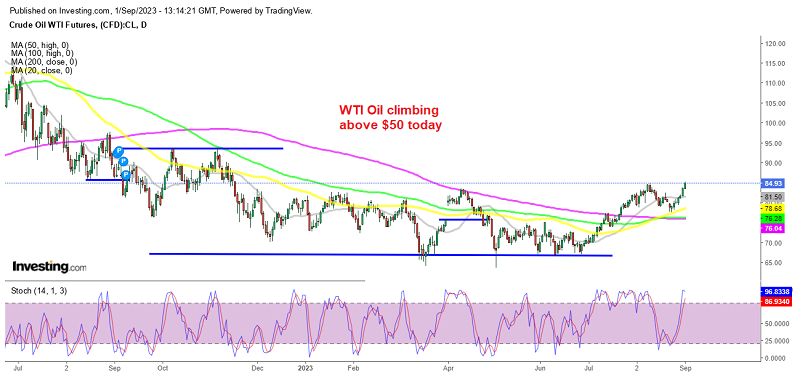
Crude Oil has been declining during most of this month, with WTI falling below $78 twice by the middle of last week, but the decline stopped right at the 50 SMA (yellow) on the H4 chart which acted as support. This moving average held the decline and after a couple of doji candlesticks on the daily chart which are bullish reversal signals, the price started moving up and yesterday we saw a $2 bullish move.
The recent rally observed over the past week was cautious, characterized by minor to moderate daily price hikes. But the pace picked up this week and it seems sufficient to push crude Oil slightly upwards for this month. This would signify the third consecutive monthly growth.
Given that crude prices are currently approaching the highest levels it put in place in early August, which are the highest levels for 2023 so far as well, there is a possibility that the market could become susceptible to significant fluctuations as we approach this level, coming just below $85. Yesterday we saw a major drawdown in US EIA inventories, which helped the buyers further.
Weekly US EIA Petroleum Inventories
- EIA crude Oil inventories -10,584K vs -3,267K expected
- Prior week crude Oil inventories were -6,135KK
- Gasoline -214K vs -933K expected
- Distillates +1235K vs +189K expected
- Refinery utilization -1.2% vs +0.0% expected
- Production estimate 12.8 mbpd vs 12.8 mbpd prior
- Impld mogas demand: 9.07 mbpd vs 8.91 mbpd prior
The API data late yesterday showed:
- Crude -11,486K
- Gasoline -1,400K
- Distillates +2,460K
This number isn’t quite as good as the API number but there was some disbelief at the huge API draw and now there are fresh bids in crude Oil. Crude Oil garnered attention as crude oil prices increased for the sixth consecutive day. Russia’s Novak drew attention to an upcoming decision by OPEC+ scheduled for next week. Despite experiencing fluctuations, WTI Oil managed to increase by $2. This rise in oil prices had a downward impact on the USD/CAD currency pair, causing it to decline for the third consecutive day and return to a level of 1.3500.
US WTI Crude Oil Live Chart
- Check out our free forex signals
- Follow the top economic events on FX Leaders economic calendar
- Trade better, discover more Forex Trading Strategies
- Open a FREE Trading Account


