Crude Oil Price Retreats to $77.65 Amid US-Jordan Tension, Supply Cuts Noted

Despite heightened tensions in the Middle East, West Texas Intermediate (WTI) crude oil sees a slight pullback, hovering around $77.65 per barrel in the Asian market hours. The retrenchment comes as the US signals a measured response to the recent threats to its forces, potentially in a tiered fashion, as per President Joe Biden’s remarks regarding the attack on a US installation in Jordan.
Market Optimism Fueled by Economic Forecasts and Supply Data
Conversely, oil markets draw some optimism from Kataib Hezbollah’s announcement to halt military actions against US troops, potentially easing geopolitical risks. The sentiment is further buoyed by the IMF’s upgraded outlook for global economic growth, with a special emphasis on the US and Chinese economies. This is echoed by the Chinese Non-Manufacturing PMI’s positive figures, suggesting a rebound in service sector activity.
Additionally, the American Petroleum Institute’s latest report indicating a significant reduction in US crude stocks by 2.5 million barrels surpasses market expectations, hinting at a tightening supply.
Investors now await the Energy Information Administration’s data to confirm this trend. These developments, coupled with the Fed’s upcoming policy decisions, are likely to be key drivers for Crude Oil’s price trajectory in the near term.
Crude Oil Price Outlook
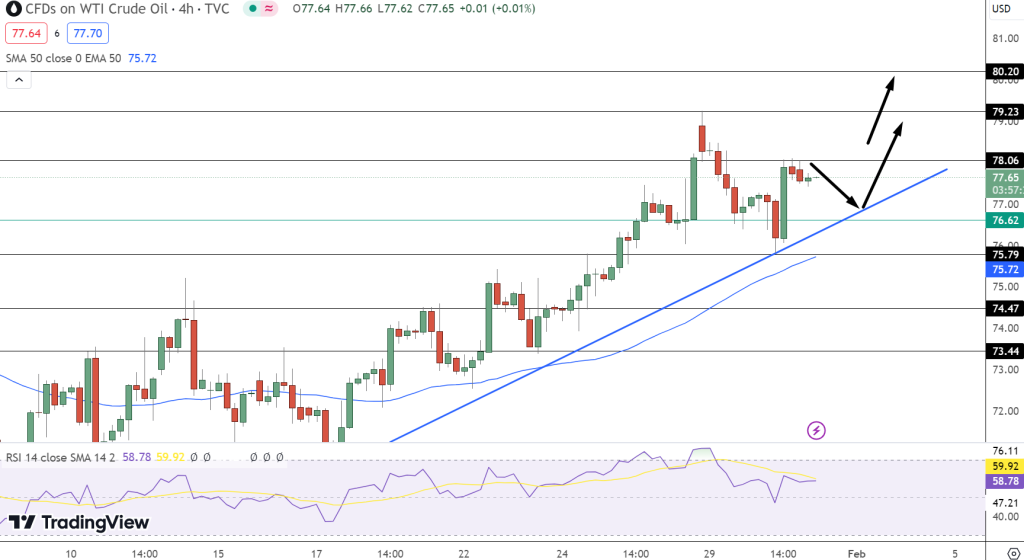
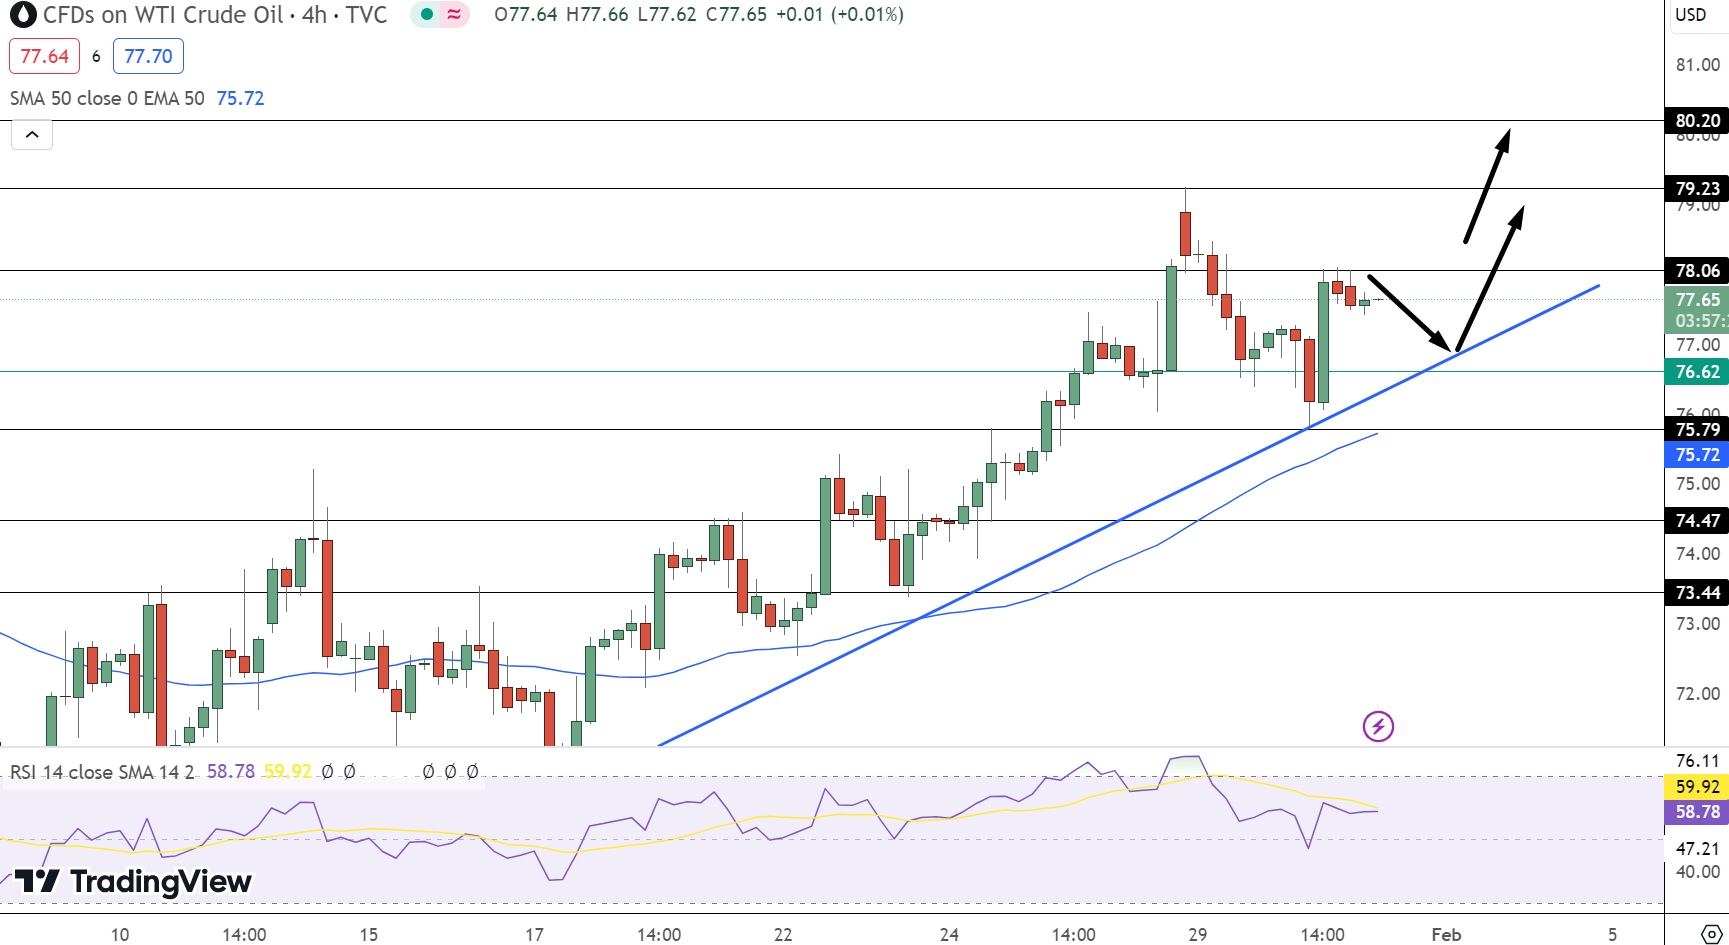
WTI Crude Oil is currently trading at $77.65, showing resilience just above the pivot point marked by the green line. The commodity has shown a modest 24-hour movement, maintaining stability within a narrow range. The chart suggests key resistance levels are poised at $78.06, $79.23, and $80.20, each potentially capping upward trends.
On the flip side, immediate support is found near $76.65, bolstered by an ascending trendline. Further support levels lie at $75.79 and $75.72, crucial for maintaining the current uptrend.
Technical indicators, including the Relative Strength Index (RSI), are positioned at 59, indicating momentum is neither overextended nor lacking, supporting a balanced market sentiment. The 50-day Exponential Moving Average (EMA) at $75.72 provides additional support, aligning with the lower support level.

Chart analysis reveals Crude Oil is drawing immediate support from an upward trendline, suggesting a continued bullish outlook if prices maintain above the $76.65 level. This technical structure could encourage buying activity in the market.


