WTI Crude Oil (USOIL) Price Hits $78.57 Amid US Inventory Draw and Soft CPI Data
WTI Crude Oil prices rose in Asian trade on Thursday, extending gains from the previous session. The softer-than-expected U.S. Consumer

WTI Crude Oil prices rose in Asian trade on Thursday, extending gains from the previous session. The softer-than-expected U.S. Consumer Price Index (CPI) reading brought down the dollar and raised hopes for interest rate cuts.
This bolstered WTI Crude Oil prices, with futures rising 0.5% to $78.57 a barrel by 20:32 ET (00:32 GMT). The prospect of lower interest rates is seen as beneficial for oil demand, as it suggests that global economic activity may not slow down as sharply as previously anticipated in 2024.
US Inventories and Supply Concerns
Official data released on Wednesday showed a larger-than-expected draw in U.S. oil inventories, shrinking by 2.5 million barrels in the week ending May 10. Gasoline and distillate stockpiles also saw unexpected declines.
This data increased optimism about improving demand in the world’s largest fuel consumer, especially with the travel-heavy summer season approaching. However, production remains near record highs, tempering some of the enthusiasm over tighter supplies.
Additionally, an oil spill in Galveston, Texas, is being closely monitored for potential supply disruptions.
Global Supply and Demand Dynamics
The International Energy Agency (IEA) recently cut its demand outlook for 2024 by 140,000 barrels per day to 1.1 million barrels per day (bpd), signaling potential weakness in global demand.
This contrasts with the Organization of the Petroleum Exporting Countries (OPEC), which maintained its forecast of 2.25 million bpd for 2024 in its monthly report on Tuesday. The differing projections underscore the uncertainty in the market regarding future demand.
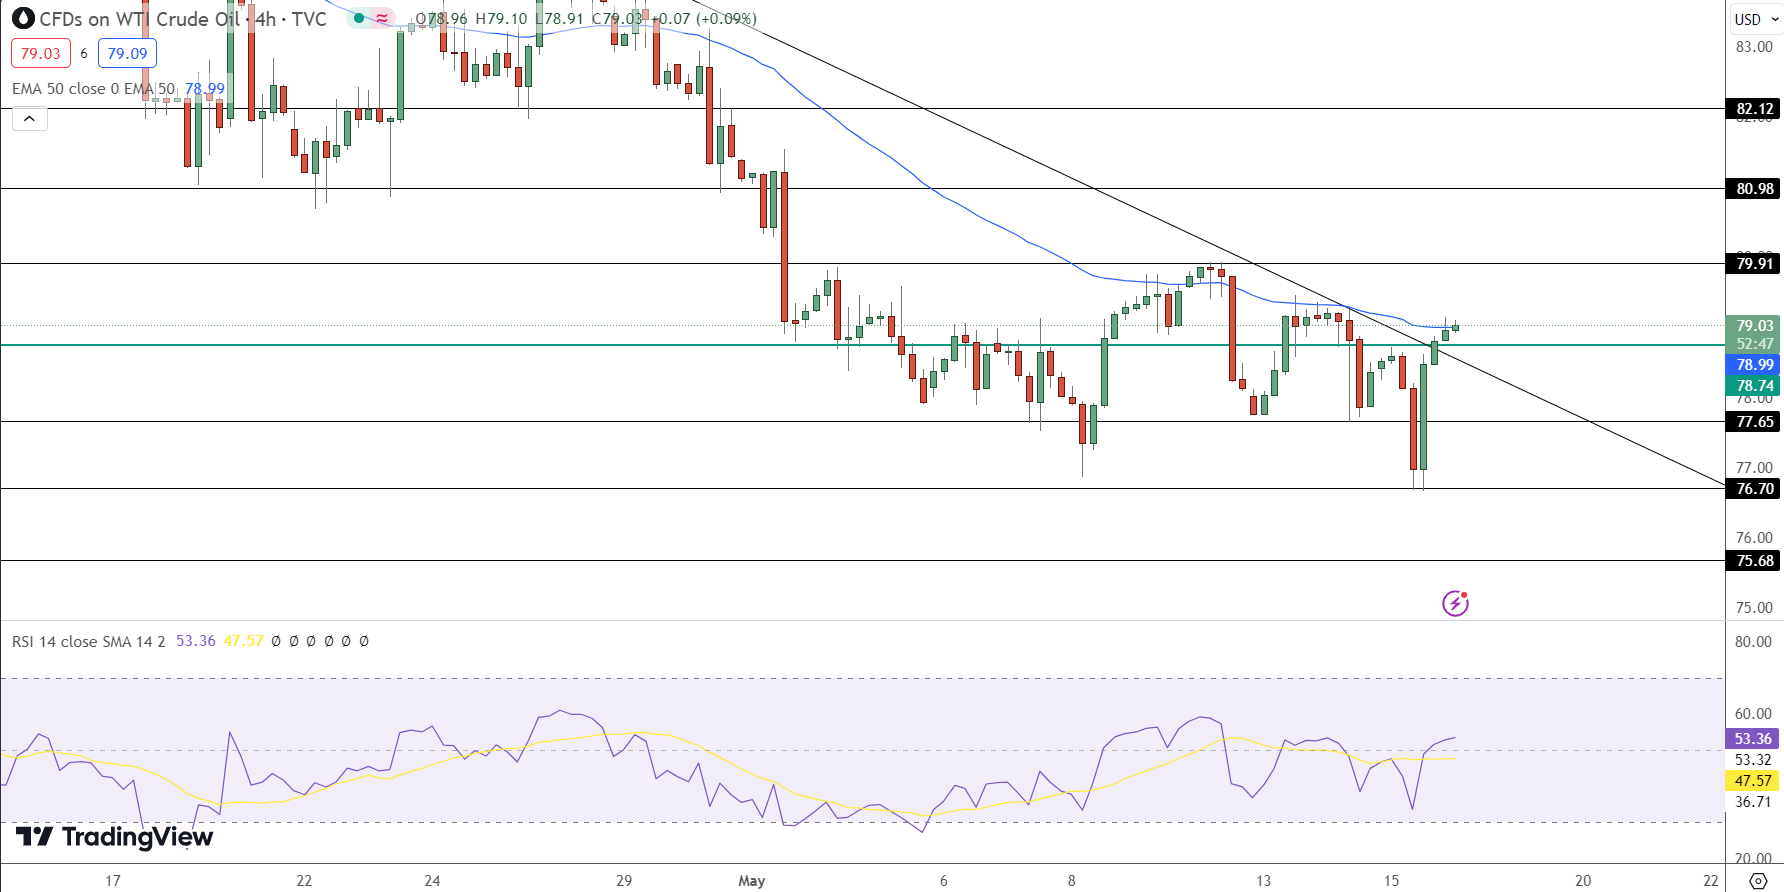
WTI Crude Oil Price Analysis
WTI Crude Oil (USOIL) is currently trading at $78.57, up 0.5%. The key price levels to watch include a pivot point at $78.85. Immediate resistance levels are at $79.50, $80.20, and $81.00. On the support side, immediate levels are at $77.30, $76.50, and $75.70.
The Relative Strength Index (RSI) stands at 65, indicating moderate bullish momentum. The 50-day Exponential Moving Average (EMA) is positioned at $77.00, with the current price maintaining a bullish stance above this average.
Conclusion
WTI Crude Oil’s outlook remains bullish above the pivot point at $78.85. A break above immediate resistance at $79.50 could propel prices higher towards $80.20 and $81.00.
Conversely, a break below the pivot point could shift momentum towards a bearish trend, targeting immediate support at $77.30 and lower levels.
- Check out our free forex signals
- Follow the top economic events on FX Leaders economic calendar
- Trade better, discover more Forex Trading Strategies
- Open a FREE Trading Account
- Read our latest reviews on: Avatrade, Exness, HFM and XM
Related Articles


Sidebar rates
Related Posts
