Forex Signals Brief June 5: BOC Rate Cut and ISM Services Today
Today the Bank of Canada is expected to start the policy easing cycle, with a 25 bps rate cut, while we also have the US ISM Services.

Yesterday the JOLTs job vacancies data for April continued to depict a bleak image of the labour market, falling to the lowest level in more than three years. Markets are susceptible to declining employment trends, so yesterday’s data improved the sentiment in the US session. The JOLTs report revealed that openings had fallen to 8.059 million in April, down from the estimated 8.355 million previously.

US Treasury yields fell once again, however, the USD rose against the commodity dollars as commodity prices fell, causing those commodity-focused currencies to fall against the USD. The price of oil is down $8 from almost $81 a week ago, with a low of $72.50 yesterday.
This represents a drop of more than 10% in five trading days. In terms of stock markets, the major European indices fell today, but US stocks rebounded as the mood improved in the US session and closed higher.
Today’s Market Expectations
Today, the main event will be the The Bank of Canada meeting, which is anticipated to start easing the policy, with a rate cut from 5.00% to 4.75%. The market-based probability increased to 90% following the disappointing Canadian GDP figures last week. Expectations were already leaning towards a 25 bps cut, following the most recent Canadian inflation report, in which the central bank’s preferred underlying inflation indicators surprised to the downside. However, the BOC will most likely avoid from pre-committing to another rate cut, stating that it will be based on facts.
The US ISM Services PMI which will be released later, is predicted to improve to 50.5 points, up from 49.4 points previously. As previously stated, the S&P Global PMIs surprised to the upside, with the Services indicator exceeding forecasts by a significant margin. The attention will most likely be on the employment sub-index ahead of the NFP report, but the statistics we have so far indicate that the US economy is doing well and that the labour market remains resilient.
Yesterday, the US made a comeback in the European session but after JOLTS Job Openings data was released, the USD stopped climbing and bond yields continued lower. We were able to capitalize on opportunities, resulting in a net positive outcome of 5 winning forex signals out of 7 trades across forex, commodities, and stock markets.
Gold Signal Hits TP as XAU Falls
Over the last two weeks, the gold price has not resumed its upward trajectory. After reaching a record high of $2,450 on May 20, the XAU/USD pair reversed and has since been trading in the lower half of the $2,300 range, with moving averages continually pulling highs lower. Yesterday’s Asian session saw gold prices fall to a three-week low of $1,915 per ounce. However, the price rose with the release of lower-than-expected US ISM manufacturing and ISM manufacturing pricing statistics. However, there was a bearish reversal which triggered the take profit target on our sell Gold signal.
XAU/USD – H4 chart
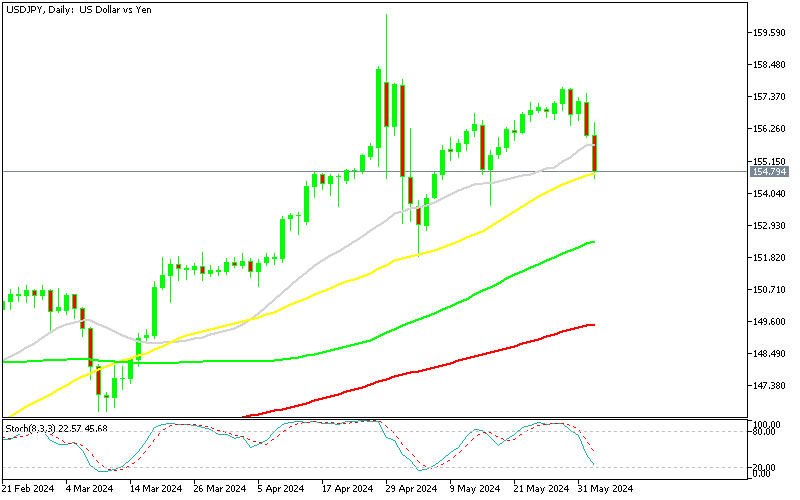
USD/JPY Retests the 50 SMA As Support Again
The USDJPY rate had been trending positively, with buyers continuing to buy USD/JPY dips even after the Bank of Japan intervened, but sellers have prevailed this week, and USD/JPY is 3 cents lower than its Monday high. Last night’s Japanese average cash earnings were positive, but there was no price activity. USD/JPY has showed substantial bullish strength versus the Japanese yen, with the pair reaching 157.70 last week; however, sellers have dominated this week, dragging on the pair and pushing it approximately 300 pips lower. The price has dropped dramatically, reaching the 50 SMA (yellow) on the daily chart.
USD/JPY – Daily Chart
Cryptocurrency Update
Bitcoin Moves Above 70K Again
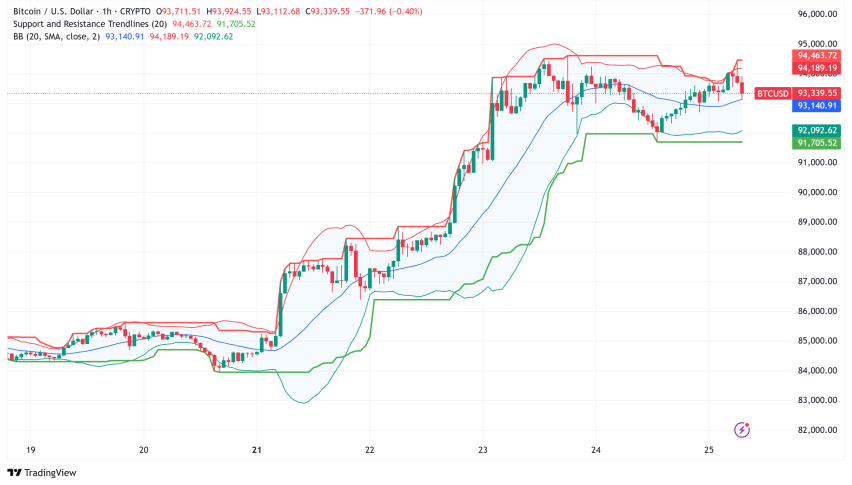
Bitcoin’s long-term uptrend is still intact, with the 100-day Simple Moving Average (SMA) acting as a key support level. While technical indicators such as the 20-day and 50-day SMAs have previously limited Bitcoin’s upward momentum, recent price activity on the daily chart suggests a break above these resistance levels. This breakout implies that the 50-day SMA may now serve as a new support level going ahead. Despite a temporary three-day drop, Bitcoin continued its upward trend on Monday, surpassing the crucial $70,000 threshold. The successful breach of major resistance levels underscores the market’s overall optimism.
BTC/USD – Daily chart
Ethereum Consolidates Below $4,000
The recent boost in confidence induced by the SEC’s more favourable stance on spot Ether ETFs has pushed Ether (ETH) to a new high of $3,832.50. This large gain from its previous high of roughly $3,000 represents a staggering 25% increase in Ethereum’s value. Capitalizing on this upward trend, we profitably closed our Ethereum buy signal last week and are looking to open another one. The Ethereum ETF’s acceptance is regarded as an important milestone, with the potential to encourage larger institutional investment and broader Ethereum adoption. This change is expected to increase market stability and liquidity, pushing prices further higher. However ETH/USD has been stabilizing below $4,000 for two weeks.
ETH/USD – Daily chart
- Check out our free forex signals
- Follow the top economic events on FX Leaders economic calendar
- Trade better, discover more Forex Trading Strategies
- Open a FREE Trading Account


