Lower Highs in Oil Despite Another Fall in EIA Crude Inventories
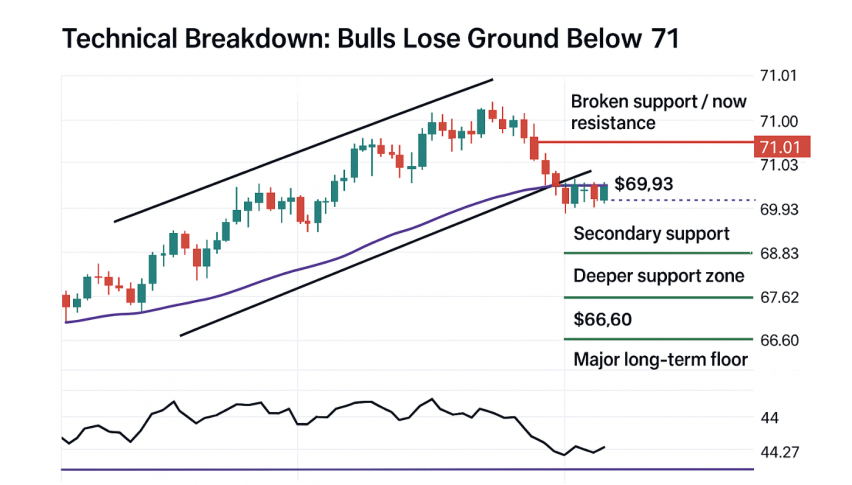
Crude oil prices had positive momentum in June, with the 50 SMA providing support, but in July, the trend reversed, and MAs turned into resistance, leading to lower highs. Despite this, improved sentiment yesterday led to a $2 rally from below $73. However, the bullish advance halted below the 50 SMA (yellow), despite the EIA’s crude inventories report.

Oil prices have been weak for the past month, driven by a stalled recovery in the Chinese economy and a global economic slowdown due to high interest rates from central banks, particularly the Federal Reserve. On Monday, WTI crude fell below this year’s low amid a financial markets meltdown, but found some support as heightened Middle East tensions raised concerns about potential oil production disruptions. The situation has been especially tense following significant escalations last week, including the killing of key Hamas and Hezbollah figures.
WTI Crude Oil Chart H4 – MAs Keep Acting As Resistance
As a result, U.S. crude oil futures rebounded on Wednesday after a three-day stock market losing streak. Rising Middle East tensions and ongoing OPEC+ production cuts have provided a floor for prices.
EIA Crude Oil Inventories
- Weekly US Crude Oil Inventories: -3,728K (vs. -700K expected)
- Prior week inventories: -3,436K
- Gasoline Inventories: +1,340K (vs. -986K expected)
- Distillate Inventories: +949K (vs. +241K expected)
- Refinery Utilization: +0.4% (vs. +0.8% expected)
- Production: 13.4 mbpd (vs. 13.3 mbpd prior)
The latest EIA crude oil inventories report revealed a significant draw in US crude oil stocks, with inventories falling by 3,728K barrels, far exceeding the expected draw of 700K barrels. This follows a previous week’s decline of 3,436K barrels, indicating a consistent reduction in crude oil inventories.
Gasoline inventories, however, rose by 1,340K barrels, contrary to the expected decline of 986K barrels. Distillate inventories also saw a larger-than-expected increase, rising by 949K barrels compared to the anticipated 241K barrels.


