Dow Jones DJIA Trims Losses on Fed Rate Cut Bets after Soft US GDP, PCE Inflation
Cooler PCE inflation data and soft Q1 GDP have given equities markets new hope, which has helped the Dow Jones Industrial Average recover...
Quick overview
- The Dow Jones Industrial Average rebounded by 300 points after a volatile session, driven by weaker-than-expected US economic data.
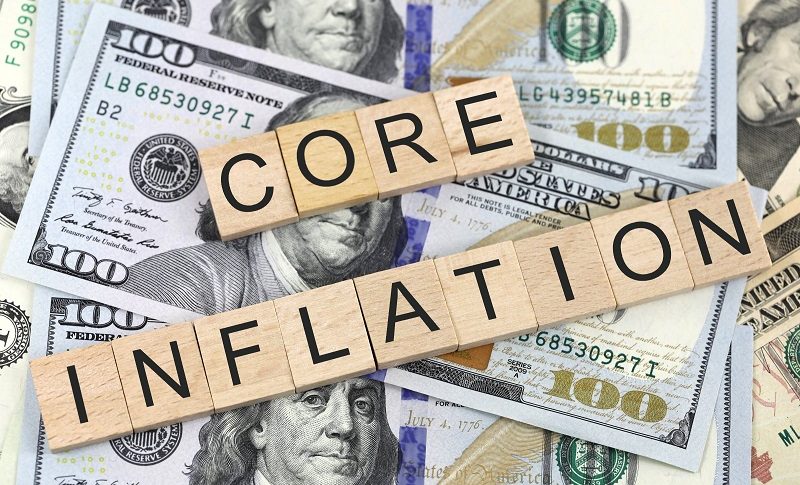
- Q1 2025 GDP contracted by -0.3%, significantly missing growth expectations, while core PCE inflation cooled to 2.6%, suggesting a dovish stance from the Federal Reserve.
- Despite initial bearish sentiment, investor confidence remained strong, particularly in large-cap stocks like Amazon, indicating a shift towards risk appetite.
- The mixed economic indicators highlight a complex landscape of slowing growth and persistent inflation, complicating the Fed's policy decisions.
Live DOW Chart

Cooler PCE inflation data and soft Q1 GDP have given equities markets new hope, which has helped the Dow Jones Industrial Average recover from an early-session decline.
Dow Jones Rebounds After Early Drop
After a volatile overnight session, the Dow Jones Industrial Average (DJIA) staged an impressive recovery on Thursday, helped by weaker-than-expected US economic data. The index initially opened lower at 40,290 points, weighed down by global macroeconomic concerns. However, a sharp reversal took hold during the US trading session, ultimately lifting the Dow by 300 points (+0.75%) to close at 40,527.
Earlier in the day, the Dow had dipped as low as 39,761—reflecting investor nervousness ahead of key data releases. Yet by the afternoon, sentiment turned decisively positive.
Soft GDP and Inflation Spark Dovish Fed Hopes
The turnaround in equities was triggered by disappointing economic figures. The US Q1 2025 GDP report showed a surprise contraction of -0.3%, far below the +0.3% growth that had been anticipated. At the same time, March’s core PCE inflation—a key measure closely watched by the Federal Reserve—cooled to 2.6% year-on-year, aligning with expectations but underscoring the continued trend of disinflation.
Together, these indicators suggest slowing economic momentum and increasing room for the Fed to adopt a more accommodative stance. Investors interpreted the data as strengthening the case for interest rate cuts later this year, which helped fuel risk appetite in equity markets.
Dow Jones Chart Daily – Investor Sentiment Holds Firm Despite Headwinds

Despite the initially bearish tone, broader investor sentiment remained resilient. Markets have been trending higher for over a week, buoyed by optimism in large-cap stocks—especially in industrials, healthcare, and tech. Amazon in particular continues to draw attention, serving as a bellwether for risk appetite.
Even as the dollar held relatively stable (despite conditions that would typically weaken it), equity markets took the lead in interpreting the economic signals through a dovish lens.
US March 2025 PCE Report – Key Highlights![US PCE core yy]()

Core PCE (excluding food & energy):
🔹 Core PCE Inflation (excludes food & energy):
- Year-over-year core PCE rose by 2.6%, exactly in line with expectations.
- This compares to a previously reported +2.8%, now revised up to +3.0%.
- Month-over-month core PCE was flat at +0.0%, slightly below the forecast of +0.1%.
- Unrounded core PCE came in at +0.028%, a significant drop from +0.38% in February.
- The supercore measure (services excluding shelter) rose +3.0% y/y, down from +3.34% prior.
- Services inflation rose just +0.15% m/m, down from the previous +0.375%, indicating moderation.
🔹 Headline PCE Inflation:
- Headline PCE y/y climbed +2.3%, slightly higher than the expected 2.2%.
- Month-over-month, the headline deflator was flat at +0.0%, as forecasted.
- Unrounded figure showed a slight decline of -0.04%, compared to a prior rise of +0.34%.
🔹 Consumer Income and Spending (March):
- Personal income rose +0.5%, beating expectations of +0.4%.
- February’s reading was revised slightly down to +0.7% from +0.8%.
- Personal spending increased +0.7%, also stronger than the +0.5% estimate.
- February’s number was revised upward to +0.5% from +0.4%.
- Real personal spending (inflation-adjusted) showed a solid gain of +0.7%, up from +0.1% prior.
- The savings rate fell to 3.9%, down notably from 4.6%, signaling consumers are tapping into savings to maintain spending.
The March PCE report painted a mixed picture. Inflation indicators continued to cool, especially core monthly readings, which came in flat, and services inflation slowed sharply. However, strong consumer spending and rising incomes highlight resilient demand, despite higher prices. The Federal Reserve is likely to view this as progress on inflation without a major dent in economic momentum, which means cutting rates, therefore a weaker USD, which didn’t happen today. However, the fall in the savings rate could hint at eventual fatigue in consumer-driven growth.
🇺🇸 Q1 2025 US GDP (Advance Estimate) – Key Highlights
🔹 Overall GDP Growth:
- US Q1 2025 GDP contracted by -0.3% (annualized), significantly missing expectations of +0.3% growth.
- This marks a stark reversal from +2.4% in Q4 2024 and +2.8% in Q3 2024, underscoring a sharp economic slowdown.
🔹 Consumer Spending:
- Personal consumption rose by just +1.8%, well below the Q4 pace of +4.0%.
- Some forecasts had anticipated an even lower figure, around +1.2%, so this was slightly better than feared—but still soft.
- Weaker consumer momentum was a major drag on headline GDP.
🔹 Final Sales (Excluding Inventories):
- Final sales of domestic product (a cleaner view of demand) declined by -2.5%, compared to +3.3% in Q4.
- This drop suggests the contraction wasn’t just about inventory corrections but reflected underlying demand weakness.
🔹 Inflation Measures:
- GDP price index (deflator): Rose +3.7%, beating the +3.0% forecast—signaling stickier inflation.
- Core PCE (Fed’s preferred inflation gauge): Came in at +3.5%, above the +3.3% estimate.
- PCE Price Index: Jumped to +3.6%, up sharply from +2.4% in Q4.
- Supercore (PCE services ex-energy and housing): Surged to +3.4%, from +2.3%, showing services inflation remains persistent.
🔹 Investment and Domestic Demand:
- Business investment (nonresidential fixed): Jumped by +9.8%, a major rebound from -3.0% in Q4.
- This signals solid corporate confidence and could help support future growth if consumer demand recovers.
- Final sales to domestic purchasers: Grew by +2.3%, below the prior +3.0%, showing slower demand across sectors.
- Full report
The first-quarter GDP report showed a surprise contraction in US economic activity, ending a streak of strong growth in late 2024. While business investment rebounded impressively, sluggish consumer spending and falling final sales signal broad-based weakness in demand.
At the same time, inflation pressures have intensified, with both headline and core metrics running hotter than expected. This combination of stagflation-like dynamics—rising prices alongside shrinking output—will likely complicate the Federal Reserve’s policy path and could reignite debates about interest rate cuts versus persistent inflation vigilance.
Conclusion
The Dow’s rebound illustrates how markets are increasingly focusing on the likelihood of a Fed pivot, rather than fretting over weak growth alone. As inflation softens and GDP surprises to the downside, expectations for rate cuts are becoming more deeply embedded—paving the way for equities to continue their recovery despite lingering macro uncertainties. The Dow is currently hovering around the 40,350 level, within striking distance of its recent highs.
Dow Jones Industrial Average Live Chart
- Check out our free forex signals
- Follow the top economic events on FX Leaders economic calendar
- Trade better, discover more Forex Trading Strategies
- Open a FREE Trading Account
Related Articles


Comments
Sidebar rates
Related Posts
