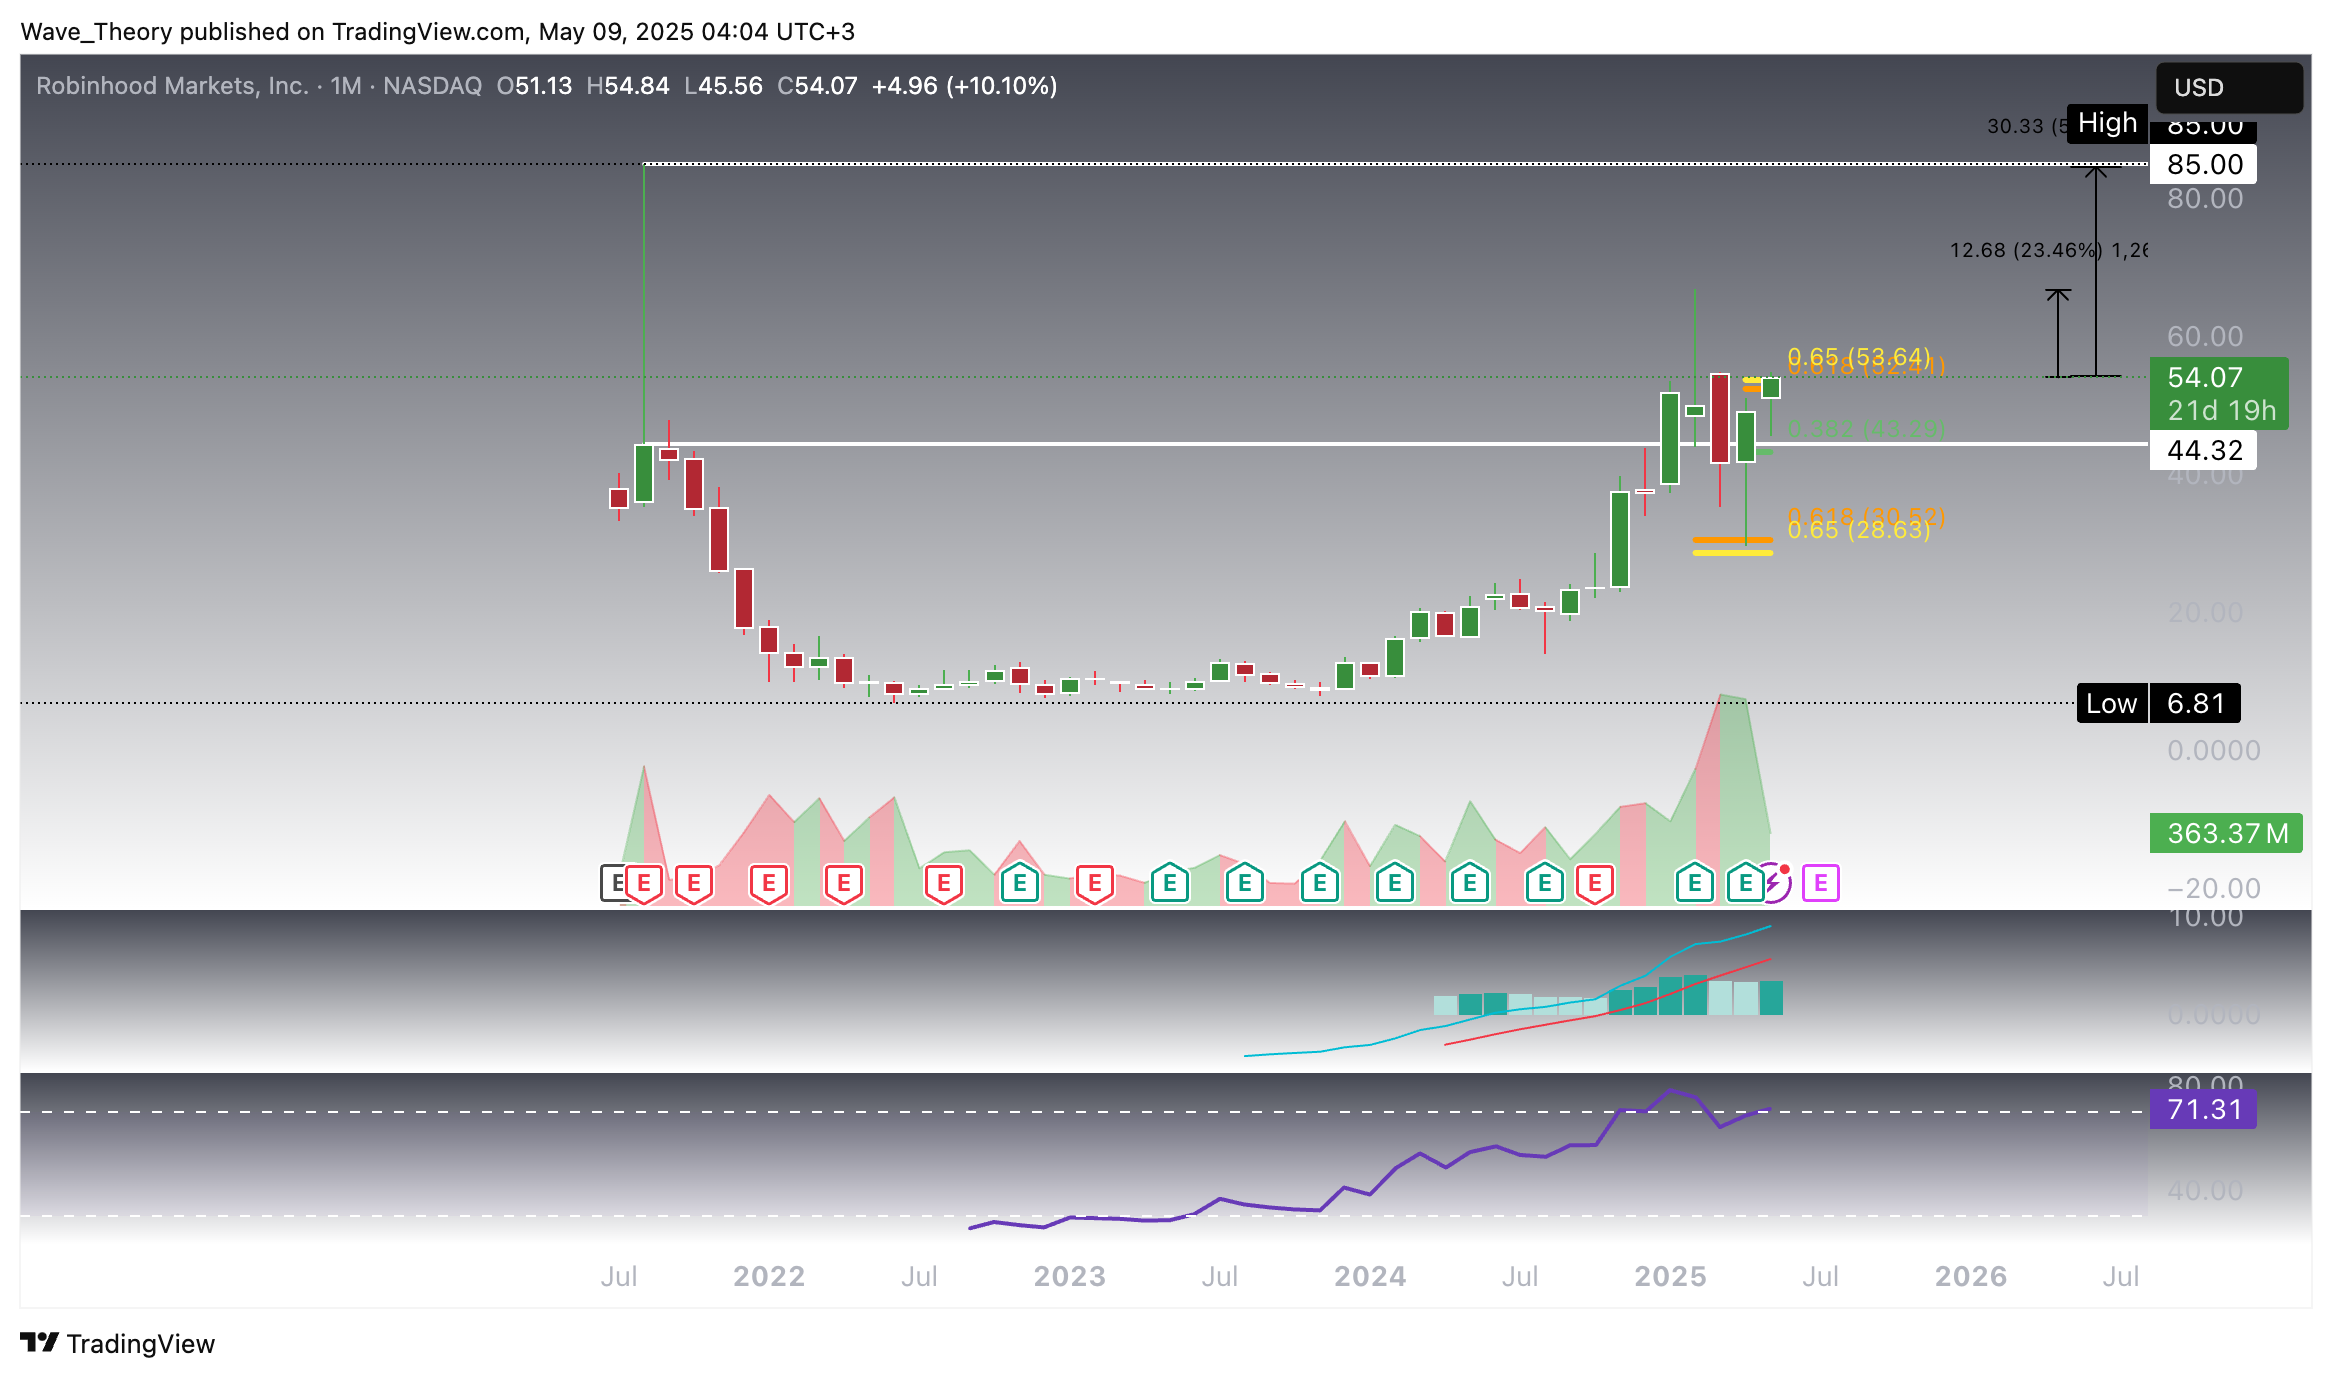
Robinhood (HOOD) has delivered a remarkable rebound, doubling in price after decisively bouncing off the golden ratio support at $29. Now, the stock is testing a key Fibonacci resistance level—raising the question: is a bullish breakout imminent?
Robinhood (HOOD) Hits Key Golden Ratio Resistance – Bullish Breakout Imminent?
Konstantin Kaiser•Monday, May 12, 2025•2 min read

Quick overview
- Robinhood (HOOD) has rebounded significantly, doubling in price after bouncing off the golden ratio support at $29.
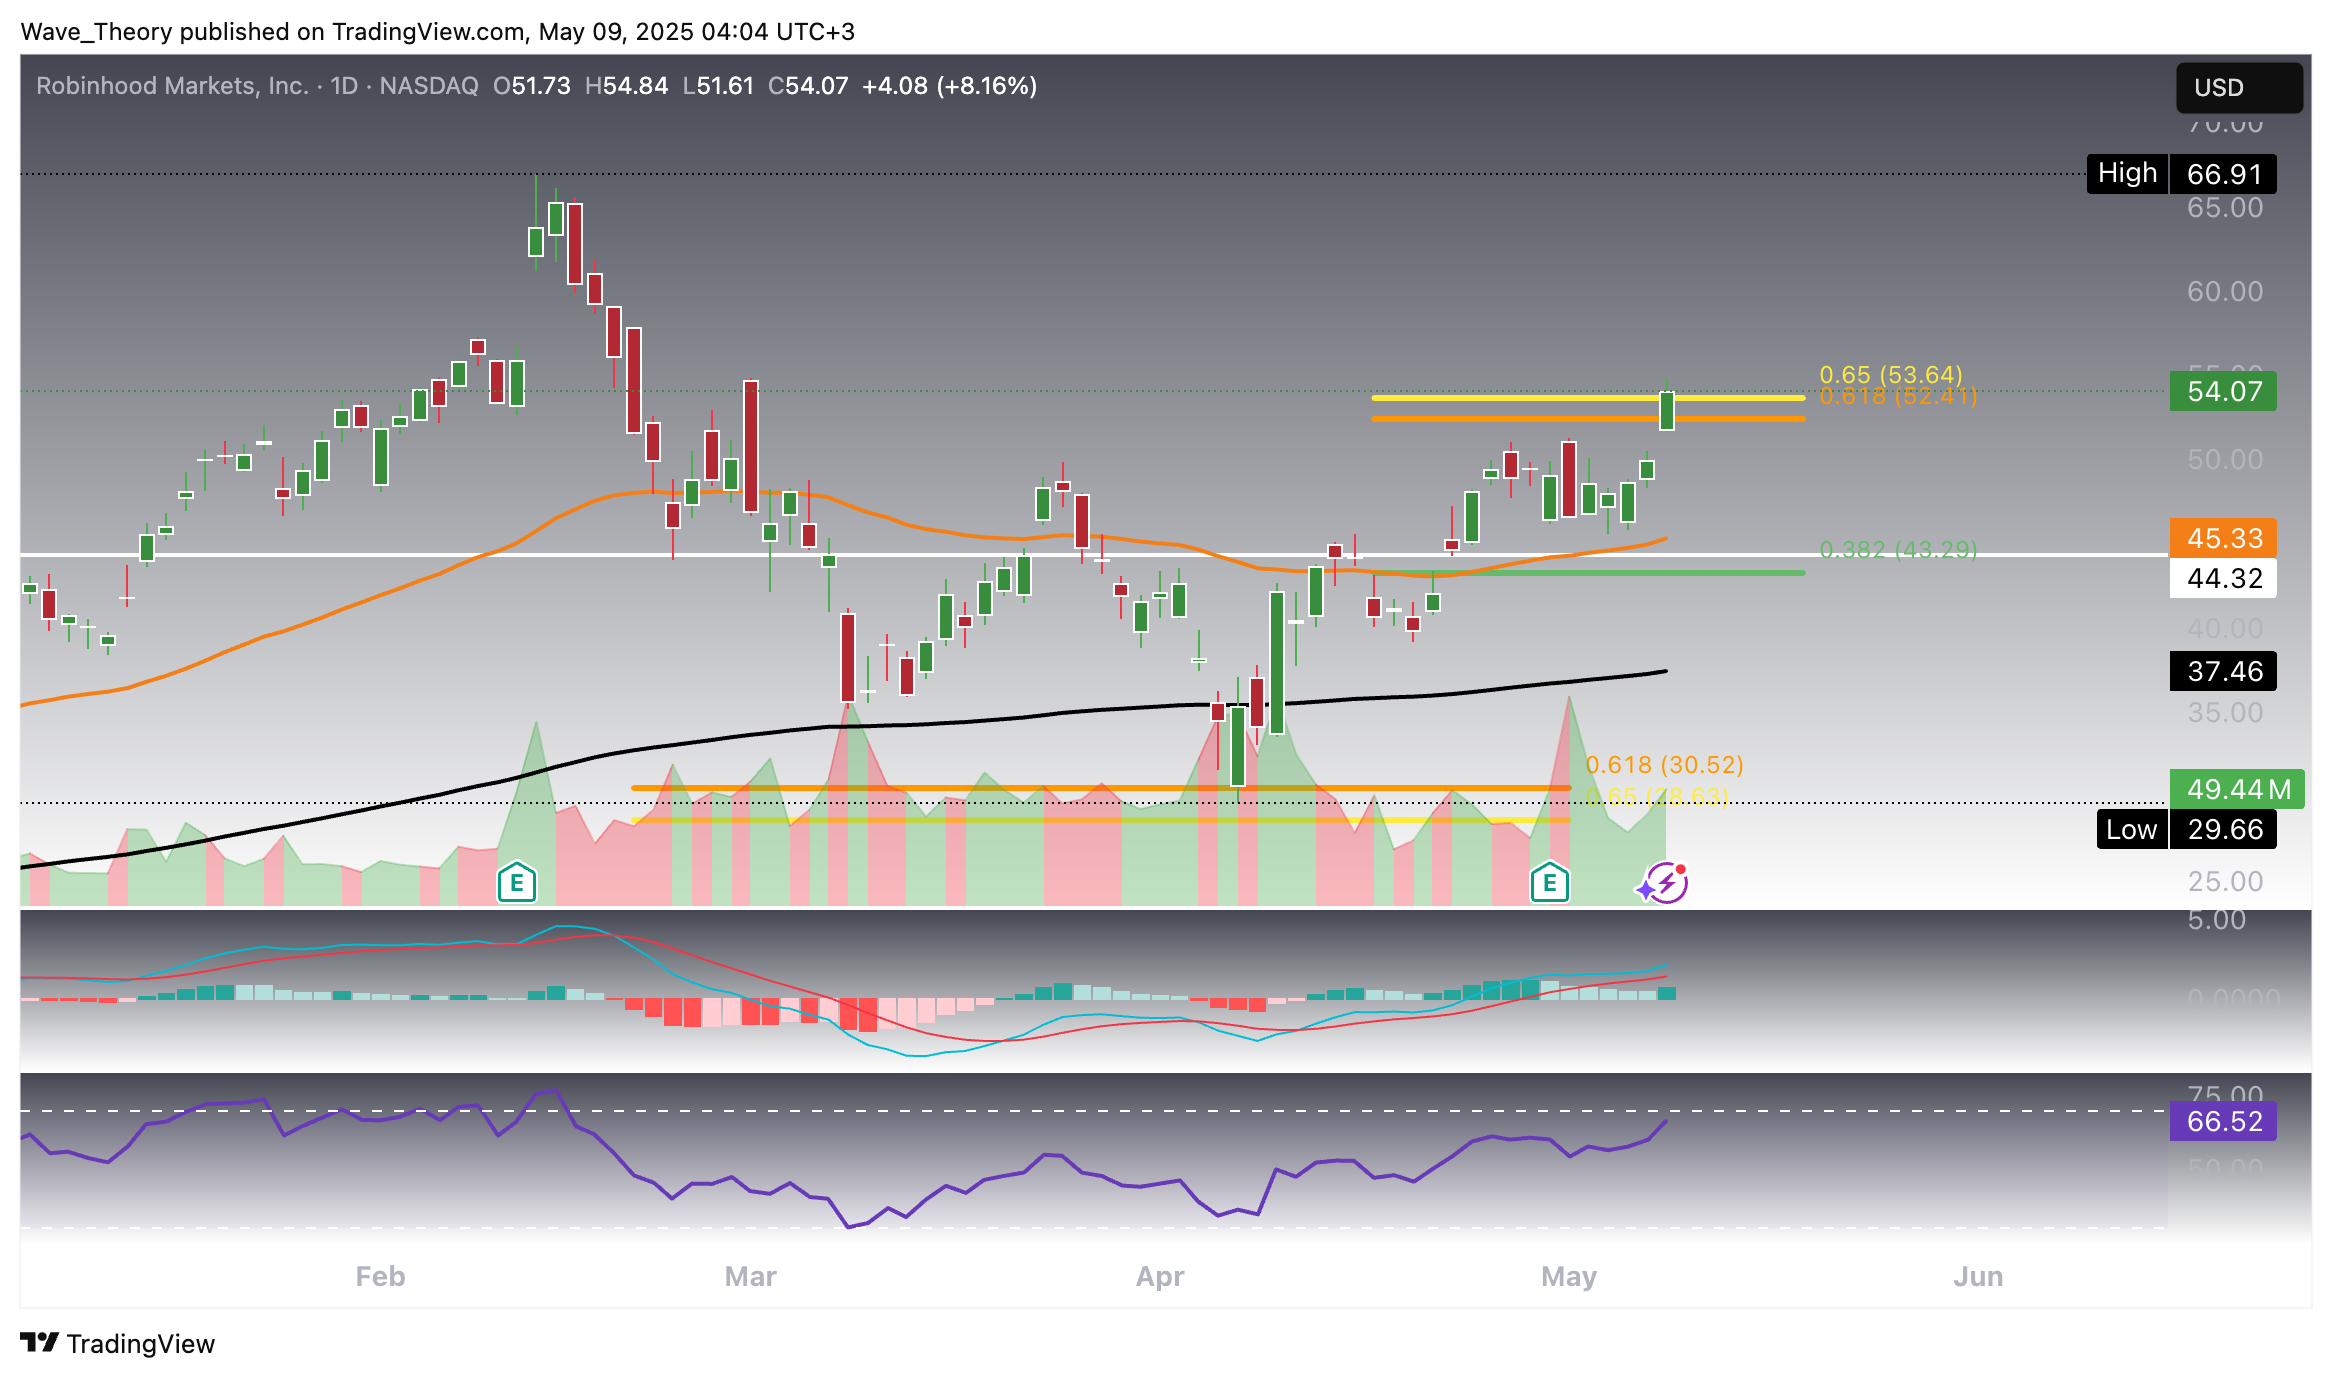
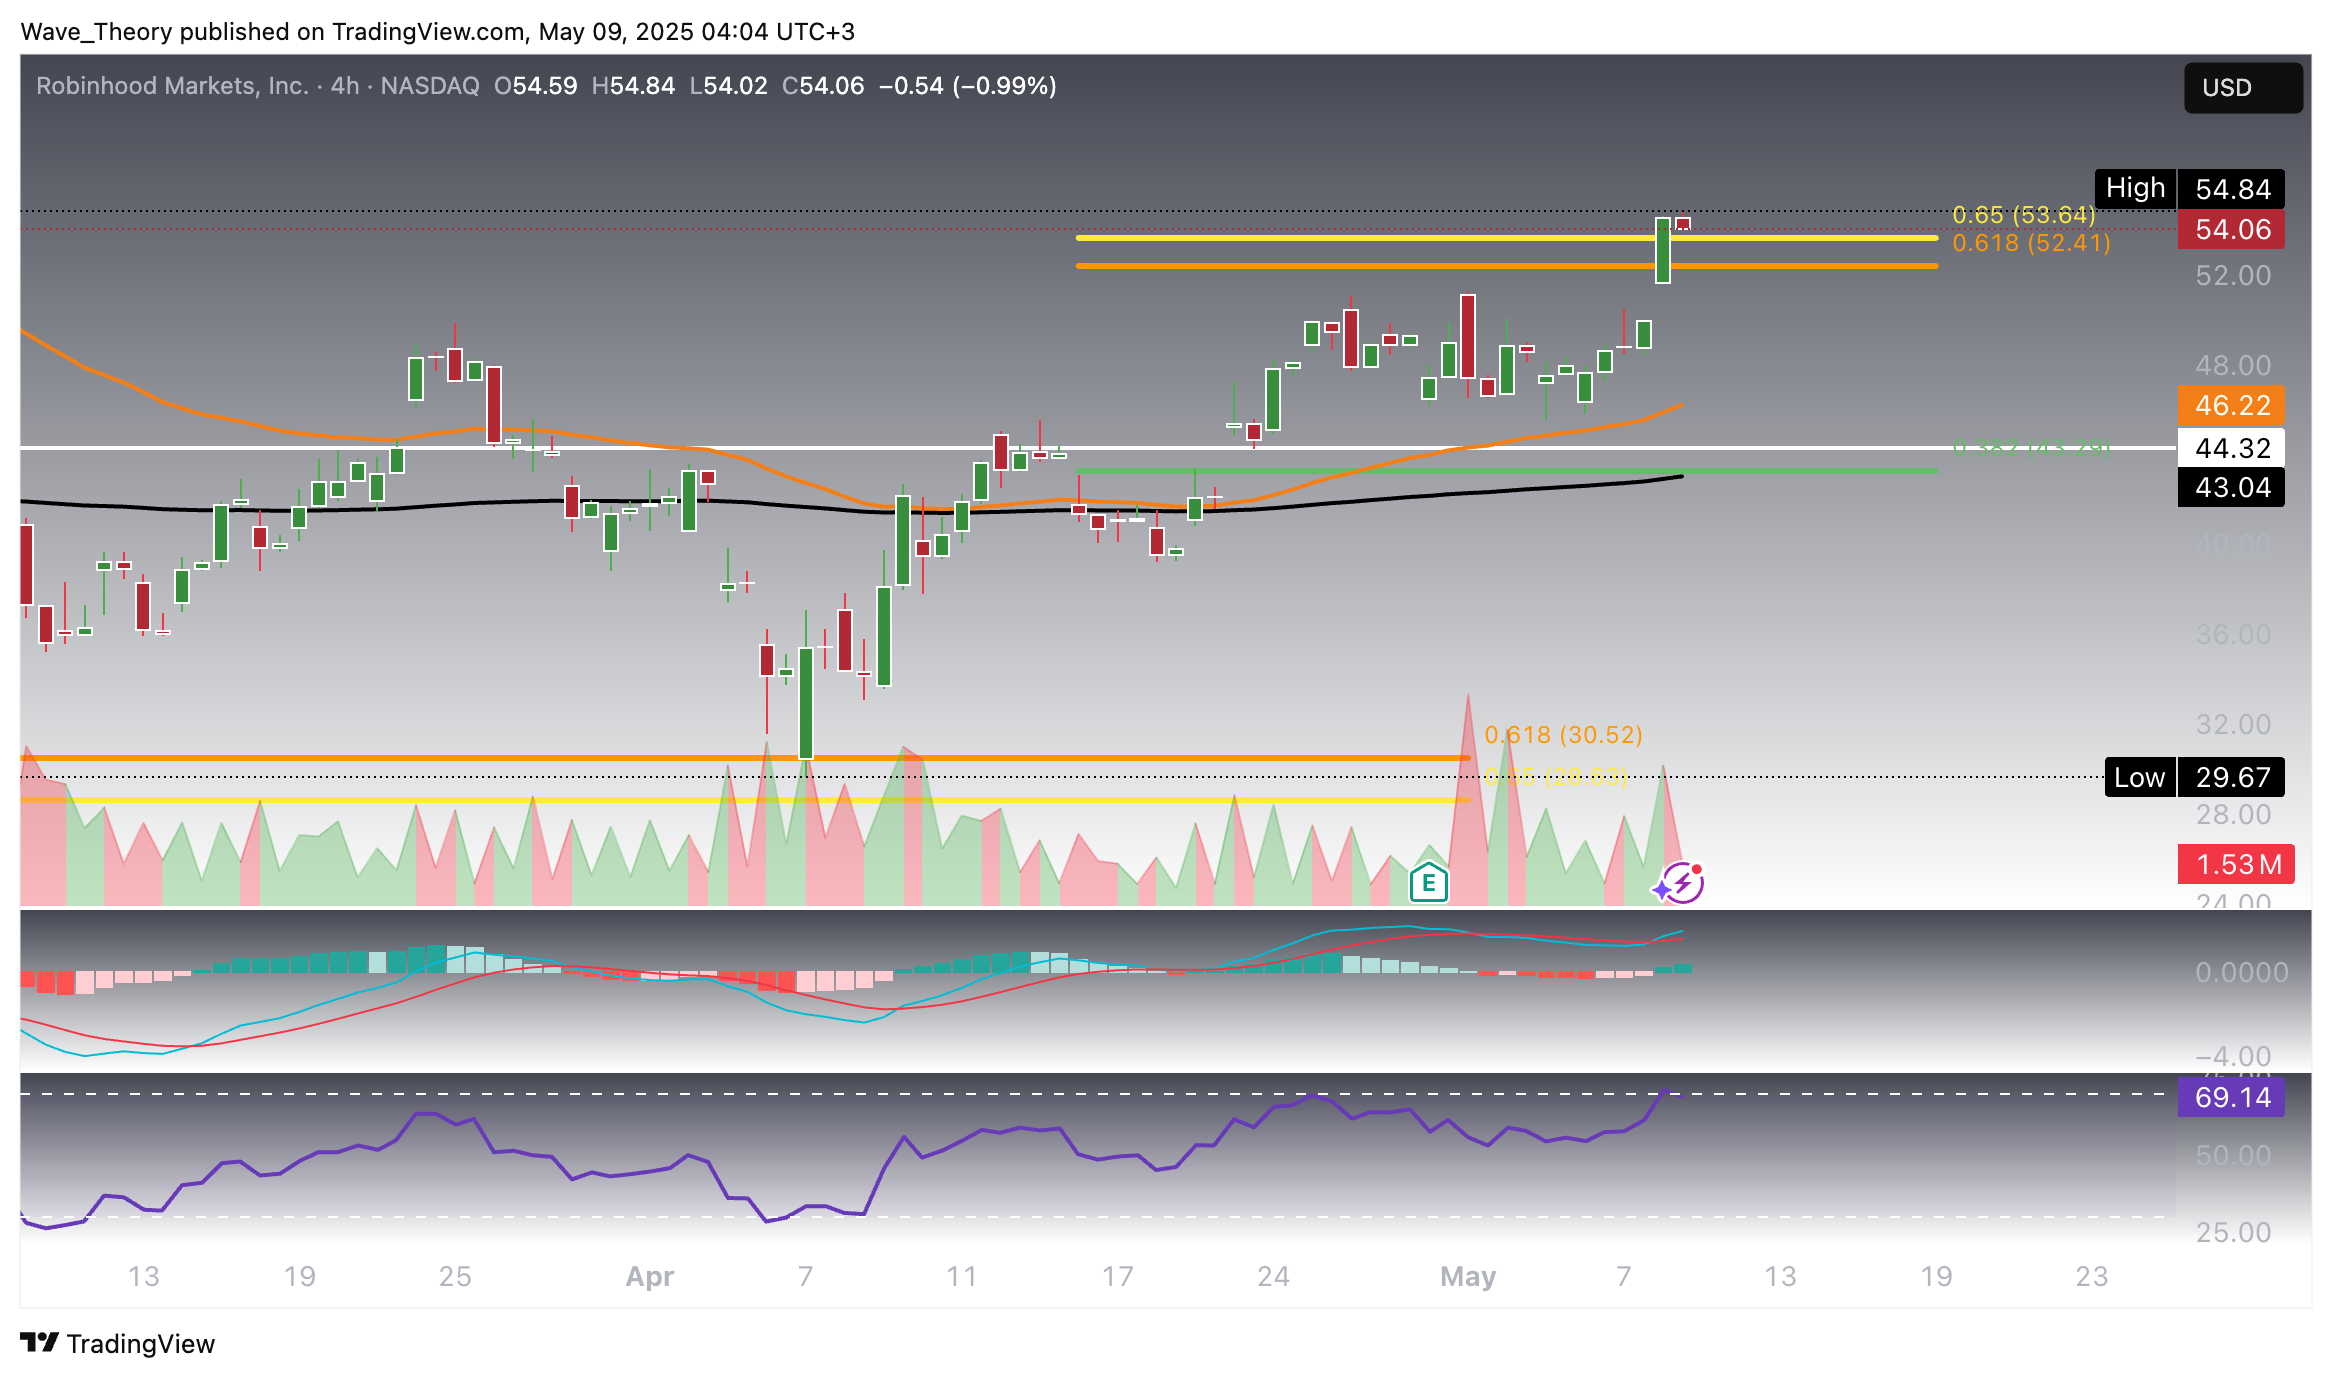
- The stock is currently testing a key Fibonacci resistance level at $54, which could lead to a bullish breakout if surpassed.
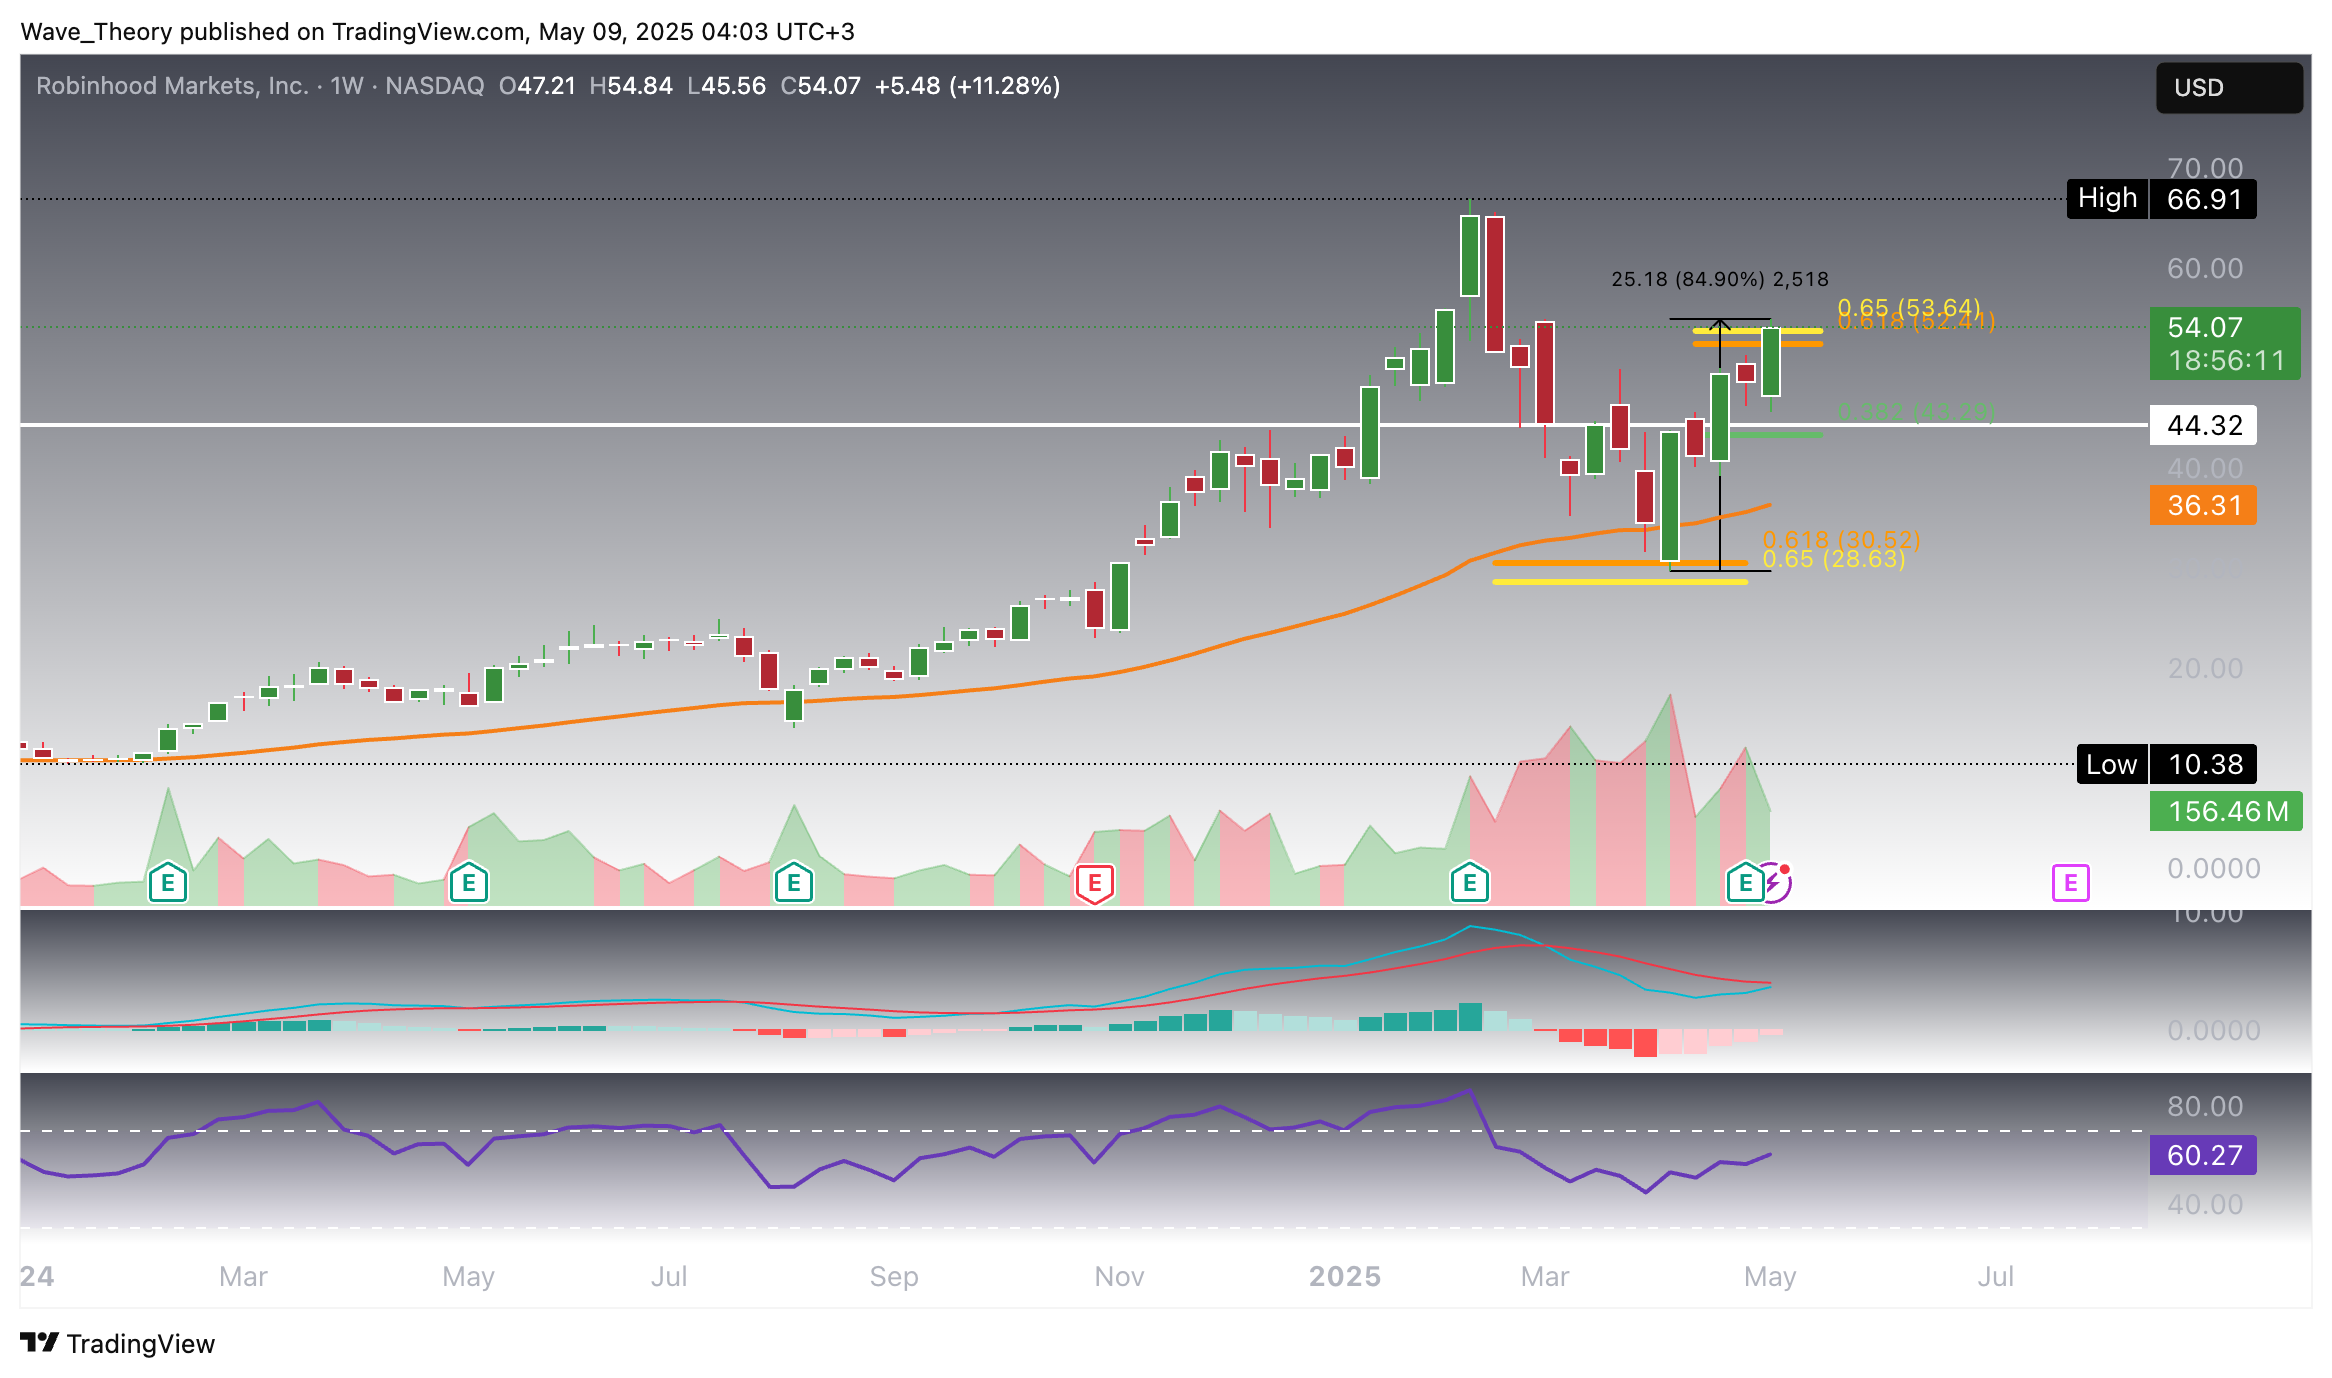
- Over the past five weeks, Robinhood has rallied 85%, supported by bullish momentum indicators like the MACD and EMAs.
- If the stock faces rejection at $54, the next significant support level is at $45.
Robinhood (HOOD) Hits Key Golden Ratio Resistance at $54
Robinhood (HOOD) previously retraced from around $67 to its golden ratio support at $29, where it established a strong bottom. Since then, the stock has surged to test the critical $54 Fibonacci resistance. A confirmed breakout above this level could open the door for a move toward the $67 high — and potentially even a run at the all-time high of $85. Technically, momentum supports the bullish outlook: the MACD lines remain crossed to the upside, and the histogram has just begun ticking higher this month after a two-month bearish phase. Meanwhile, the RSI is gradually approaching overbought territory, but shows no signs of divergence or reversal for now.

Robinhood (HOOD) Stock Surged 85% in Just Five Weeks
Robinhood has delivered an impressive 85% rally over the past five weeks. Supporting this move, the MACD histogram has been ticking higher throughout the same period, with the MACD lines now on the verge of a bullish crossover. Meanwhile, the RSI remains neutral, offering neither bullish nor bearish signals at this stage.

Robinhood (HOOD) Stock: More Bullish Signals on the Daily Chart
The daily chart reveals strengthening bullish momentum for Robinhood, with both the EMAs and MACD lines in a bullish crossover, confirming a short- to medium-term uptrend. The MACD histogram has begun ticking higher today after a six-day downtrend, while the RSI approaches overbought territory but shows no bearish divergence. Should HOOD face rejection at the critical resistance level of $54, the next significant support lies at $45.

Robinhood (HOOD) 4H Chart: Similar Bullish Outlook
The 4-hour chart reinforces the bullish narrative for Robinhood (HOOD), as the EMAs display a golden crossover, confirming short-term upward momentum. The MACD lines remain bullishly crossed, with the histogram continuing its ascent. Meanwhile, the RSI hovers in neutral territory, indicating no immediate directional pressure.

Summary
Robinhood (HOOD) has demonstrated strong bullish momentum, surging 85% over the past five weeks and rebounding sharply from the $29 golden ratio support level to currently challenge key Fibonacci resistance at $54. A successful breakout here could open the path toward the $67 high and potentially the all-time high at $85.
Across all timeframes—weekly, daily, and 4H—the indicators align bullishly:
MACD: Bullishly crossed on higher timeframes, with the histogram beginning to tick higher again.
EMAs: Display golden crossovers, confirming the trend in the short to medium term.
RSI: Approaching overbought levels, but without bearish divergences or reversal signals.
Should HOOD face rejection at $54, significant support lies around the $45 level. Overall, the trend remains bullish, and a breakout above $54 would likely accelerate the uptrend.
- Check out our free forex signals
- Follow the top economic events on FX Leaders economic calendar
- Trade better, discover more Forex Trading Strategies
- Open a FREE Trading Account
ABOUT THE AUTHOR
See More
Konstantin Kaiser
Financial Writer and Market Analyst
Konstantin Kaiser comes from a data science background and has significant experience in quantitative trading. His interest in technology took a notable turn in 2013 when he discovered Bitcoin and was instantly intrigued by the potential of this disruptive technology.
Related Articles
Comments
0
0
votes
Article Rating
Subscribe
Login
Please login to comment
0 Comments
Oldest
Newest
Most Voted
Inline Feedbacks
View all comments
Sidebar rates
HFM
Related Posts
Doo Prime
XM
Best Forex Brokers
