3 Black Crows In A Bear Dominated Gold – Trade Plan!


Last week, the safe haven asset, gold succumbed to the stronger dollar. However, the gold should be able to avoid further losses this week if the Federal Reserve delivers a hawkish policy stance.
The gold prices have dropped below $1295.93, merely due to the increasing demand for the US dollar. We are already aware of the negative correlation between commodities and the greenback. Hence, the gold is still trading under pressure due to the Fed policy meeting ahead.
Federal Reserve & The Gold Prices
The US central bank, Federal Reserve meeting will be the most crucial event of the week with the Fed fund rate decision, FOMC statement, and Fed Chair Janet Yellen’s press conference expected on Wednesday, June 14th.
Overall, the Fed is expected to hike the interest rates to 1.25% from 1%. Since the market trades based on sentiments, we have seen major drops in the gold prices because of soaring the US dollar. Personally, I think that the gold has already been "priced In" 1.25% interest rate hiked sentiment and now with the release of the actual news, the market may reverse.
It's too early to decide whether the gold has priced in the sentiment or not. All we can do is to wait for Tuesday's market to close and in our live market update on gold. We will make sure to cover this segment of the market.
Forex Trading Signal
Frankly, the gold is trading with an unclear trend and thin trading volume. This is because most traders are awaiting the US interest rate decision. I would like to stay on the sell side below $1271 with a stop loss above $1275 and a take profit around $1259.
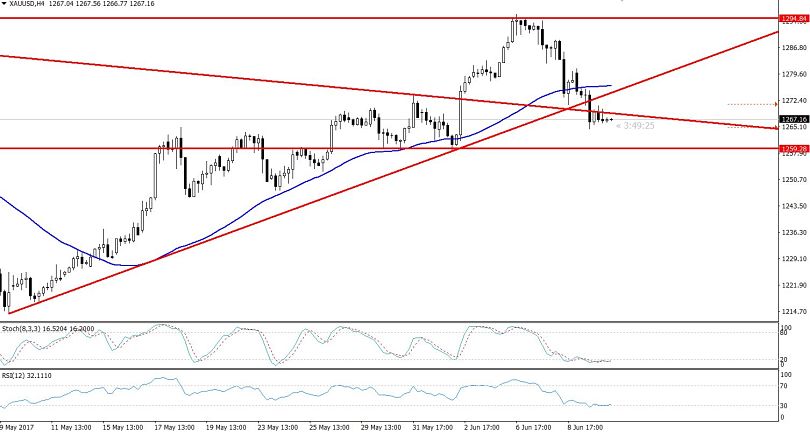
Gold – 4-hour Chart
Technical Outlook – Intraday
On the 4-hour chart, the gold has not only completed the 61.8% Fibonacci retracement at $1272 but has also broken below this particular level. The breakage of 61.8% Fibonacci trading level signifies a bearish reversal in the precious metal.
Most importantly, on the daily chart, we can see the "three black crows" pattern followed by a massive bullish trend. This demonstrates that sellers have dominated the buyers and a selling trend may begin soon.
Additionally, the 50-periods EMA is supporting the traders' selling sentiment. Lastly, the leading indicators, including the Stochastic and the RSI, have entered the selling region, crossing below 50. Stay updated for further updates and Forex Trading Signals in the European and US sessions.