6 days out of 7 – the Bears are Serving Aces on the GBP/USD!


The markets didn’t move much today, and good trading opportunities were rare. The US Dollar strengthened against all the other major currencies, and also against the Pound. In the last seven trading days, the GBP/USD only printed one positive day. The bulls are getting smoked here!
The Brexit matter is haunting the Pound again. The prospects of a “Soft Brexit” don’t seem great at the moment. The French president François Hollande is adamant that Britain may not partake of EU (European Union) membership advantages after leaving it. He also said that Britain would become an outsider to the EU and that the UK has made a bad choice at a bad moment. This is not good for the Pound at all! If the UK failed to retain any of the perks which it enjoyed in the EU, the British economy could suffer severely. Let’s look at a few charts and see how the Pound has suffered in the last couple of days…
GBP/USD – 'Great' British Pound Bites the Dust
 GBP/USD Daily Chart
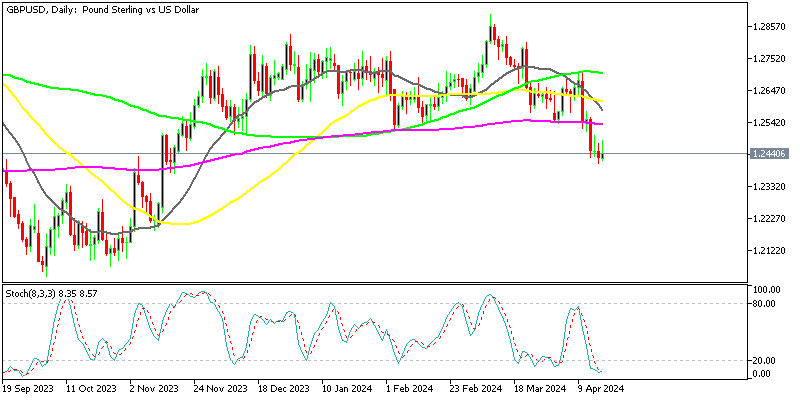
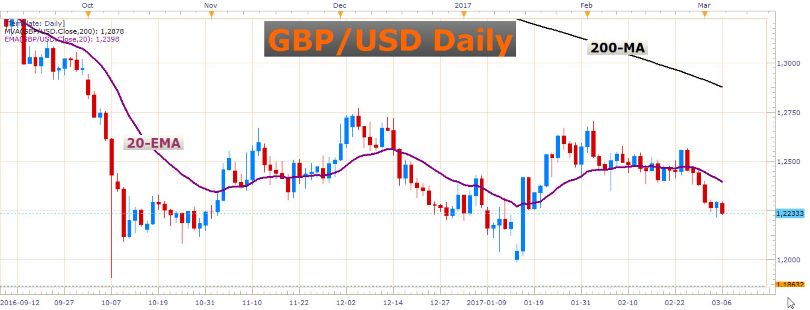
Although the GBP/USD has been trading in a broad range for several months, the price action which preceded this range was extremely bearish. Look at the large red candles at the left of this chart. This is called an impulse, or an impulsive move, in trading terms. This really aggressive selling in the direction of the prevailing long-term trend really means a lot. What is the most important lesson in trading? The trend is your friend! Considering that the pair has failed to break out of this range to the topside, we can approach this range with a bearish bias because the long-term trend is down. Of course, anything can happen, but the probability of more downside looks good. At the moment it looks like this pair could easily revisit the bottom of this large range. I would like to see a break of this range bottom as well, although a strong layer of support has been formed in that region. Here is a weekly chart just to give you some more perspective:
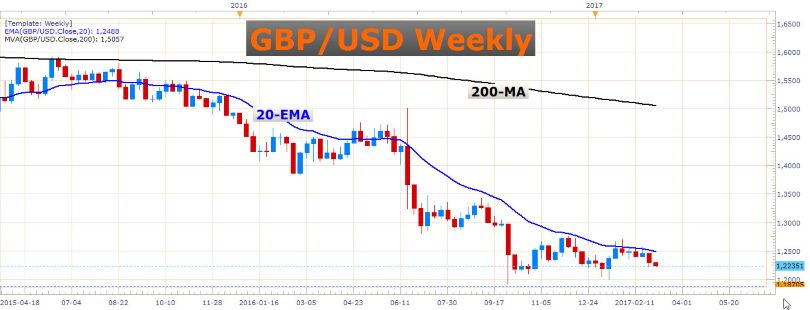 GBP/USD Weekly Chart
Here we can see that the price is still trading below the 20-week exponential moving average. It looks like a price squeeze is taking place, which favors a break to the downside. Of course, this could take weeks, or even months to play out. On the other hand, we could see a break below this range bottom in the next few hours. That’s what I like about FX trading – you never know what lies ahead, and how big the next move might be.
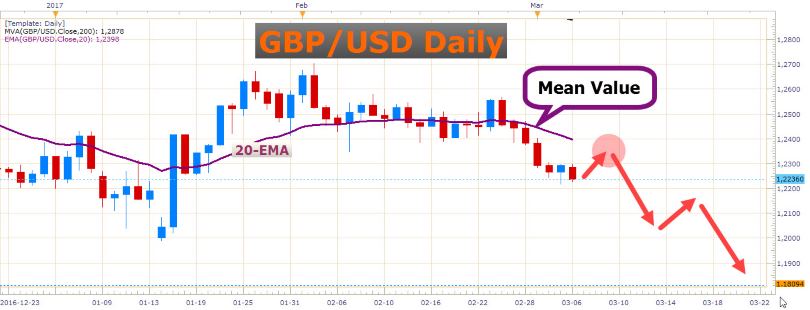
Although the GBP/USD is looking really bullish at the moment, the current market price might not be the best place to enter short. I just returned from a great vacation at the South Coast of Natal here in South Africa. Where we stayed, we could hear the waves all the time. It made me think of how the currency market’s price action is many times compared to the waves of the sea. The ocean isn’t flat and neither does the FX market move in straight lines. Even in a strong trend, you always find impulses and corrections, just like the waves and tides of the ocean move to and fro all the time. The GBP/USD has made a strong move away from the mean value which is indicated by the 20-day exponential moving average on the daily chart. Here is the daily chart again:
 GBP/USD Daily Chart
Novice traders often get excited when a currency pair sells off aggressively. They can’t wait for a retracement and chase the price which is often situated at extremes far from the mean. The market suddenly makes a correction to the mean, which is very natural, just like the wave action of the sea. These traders become trapped because they entered at a poor price, and they are soon forced out of their positions.
Trading isn't easy, and you need strong discipline to execute even the most profitable forex trading strategies. There is no space for getting over-excited, chasing the price, and similar novice trading practices.
When the price retraces to the 20-day exponential moving average, however, your chances of catching a great trade is much better. After all, a surfer needs good timing to get the most out of a large wave. Of course, this is just a general guideline, and you needn’t necessarily restrict yourself to only take entries on the 20-EMA. However, it would be much better to enter on some sort of a retracement closer to the mean, than to enter right now at this extended price. Sometimes the price doesn’t come close to the 20-day exponential moving average for several weeks. In that case, we can use smaller timeframes to time our entries, but then we would likely use smaller targets, and of course, tighter stop losses.
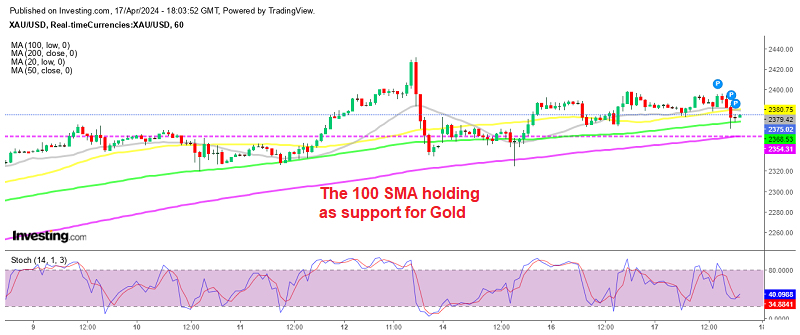
Gold – Be Careful Bulls!
 Gold Daily Chart
Just before we do some gold price analysis, have you checked out our forex signals lately? We are actively expanding the list of assets we provide trading signals on and guess what – we're pulling in the pips on gold now as well! This volatile commodity is a fantastic instrument to compliment your trading portfolio.
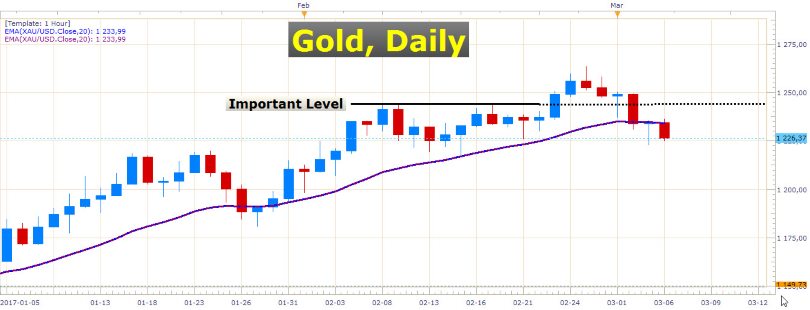
Gold has traded right through an important swing level in the last couple of days. This raises concerns about a further decline in the price of this precious commodity. Do you see the second last candle in this chart? It looks like a good bullish rejection candle. But is it really such a good trigger to go long? Well, it actually isn’t. First of all, the broken swing level is an important warning. Secondly, the size of this rejection candle is somewhat underwhelming. The third problem is observed on the weekly chart:
 Gold Weekly Chart
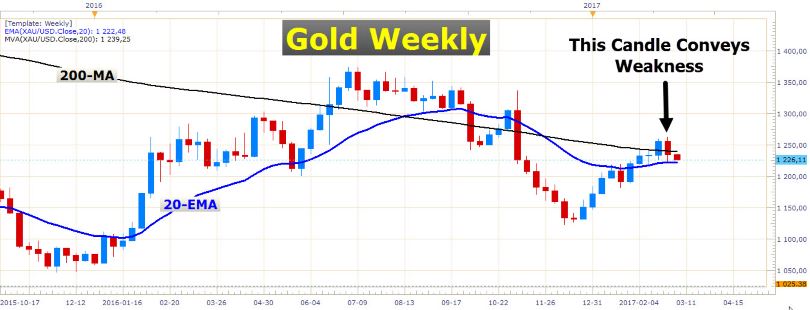
The picture looks bearish, and the bulls are clearly struggling to keep up their heads. The candle I marked in this chart has already produced some bearish follow-through as you can see. Certainly, there could be a move higher from here, but a long trade in this instance isn’t a good bet. Remember, if you’re not sure about a trade setup, rather don’t trade it. There will always be other great opportunities to seize!
News
Don’t forget about the RBA’s (Reserve Bank of Australia’s) interest rate decision and rate statement on Tuesday at 03:30 GMT. This is an important event which can cause substantial volatility.
Have a great day in the markets!