The 200 SMA Holds in NZD/USD, Now We Head Back Down


A few hours ago we opened a sell forex signal in NZD/USD as it tried the upside in the morning but failed to take out yesterday´s high or break the 200 SMA on the H1 chart. We moved down for a moment, moved back up and now we´re heading back down.
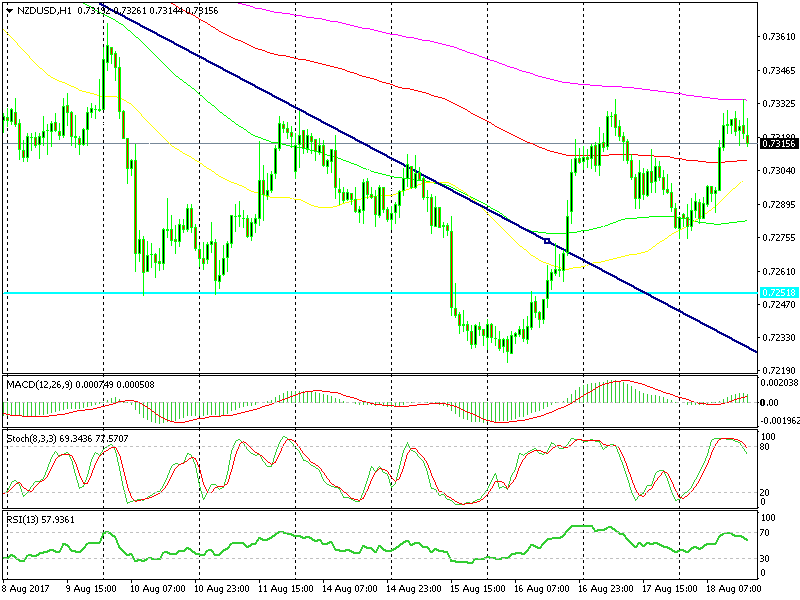 This chart right now looks pretty bearish
This moving average held all attempts from the buyers today trying to push higher as the USD was feeling sort of weak, so it looks like a solid resistance. Actually, the whole area around there looks like strong resistance.
There´s a resistance level up here as well as the 100 SMA on the h4chart, both of which we highlighted previously.
We are posting the hourly forex chart here, but if you switch to the h4 chart, you can see that the previously h4 candlestick closed as a doji which is a reversing indicator. Besides that, the stochastic indicator is almost overbought and it is turning down together with the price, which puts our signal at a decent place. We are about 10 pips in profit as I speak.