A Big Level Above for GBP/USD, Waiting to Reverse This Pair


At this time last year, GBP/USD used to be 20 cents lower. The GBP should have been the currency to head into the abyss in 2017, but instead, the market pushed the US down that hole last year, go figure.
As a result, this forex pair has been climbing nonstop for about a year, but now we are approaching a big level.
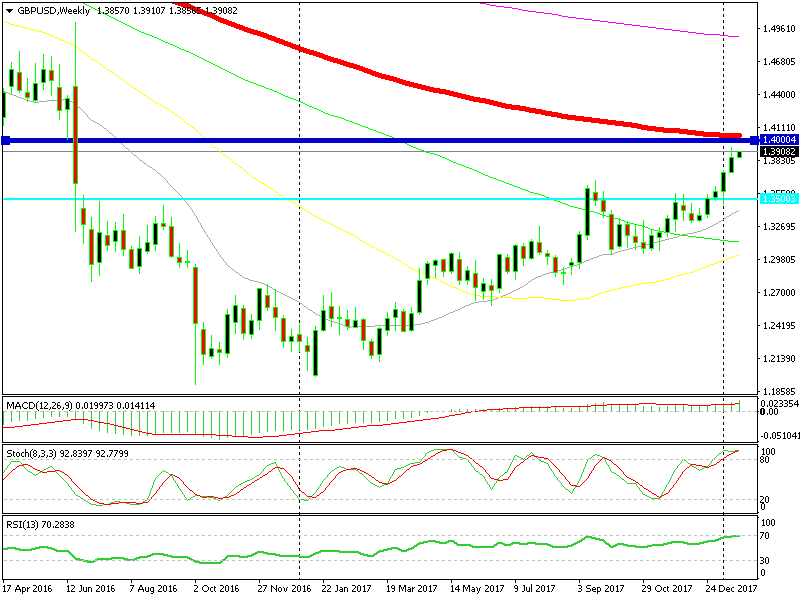
The 100 SMA is standing just above 1.40
As you can see from the weekly chart above, GBP/USD is now approaching the 1.40 level. This is a big round number, so it should provide some solid resistance.
But more importantly than that, the area above 1.40 has been the normal trading zone for this pair. GBP/USD has traded above this level forever. It only broke below it the day after the Brexit referendum. The price has traded below 1.40 since then, but the normal trading zone has been above 1.40 before.
The 100 SMA
This is not a normal time for the UK. Brexit is coming up, so I don’t think forex traders have the guts to stay long on this pair above 1.40. Besides that, the 100 SMA (red) is standing at 1.4040s at the moment on the weekly chart, so that will provide additional resistance up there.
Stochastic Indicator
The stochastic is overbought on all timeframes, so a reverse should be on its way for this pair. That said, we don’t know how Brexit will end up. Some UK businesswoman pleaded for a soft Brexit over the weekend, so a soft Brexit is a risk for GBP/USD sellers, we should keep that in mind.