Yesterday, our analysis on gold entitled, Gold Stuck In A Range – When Can We Expect A Breakout? turned out to be incredibly accurate. The precious metal gold placed a high of $1253, while our take profit was at $1252. Alas, we closed our trade taking fewer green pips before the release of U.S economic figures, to avoid uncertain fluctuations.
We have no regrets, because we trade technicals rather than luck.
The stronger U.S dollar caused a drop in gold. Favorable new home sale figures and a strong trendline support in a daily timeframe attracted buyers.
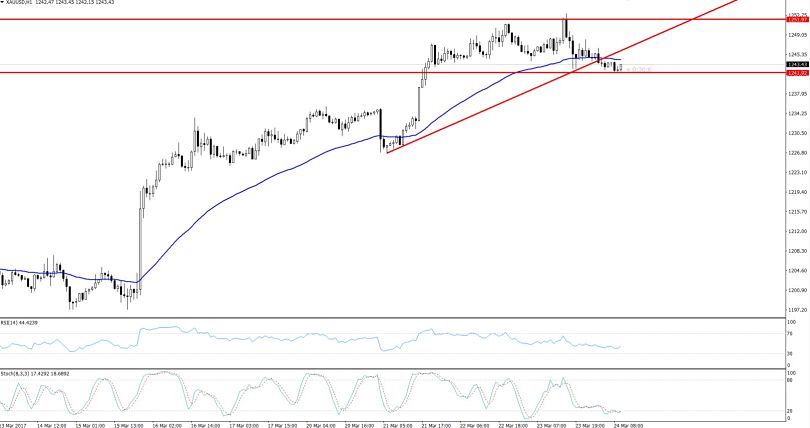
Gold – Hourly Chart
Technical Outlook
At the moment, gold is trading at $1243 after breaking a strong trendline support level of $1244. The RSI (at 41) and the candles below EMA are signaling a selling bias in the yellow metal. Moreover, it has come out of an ascending triangle pattern.
So can we expect a big drop in Gold? Absolutely!
That is if the market keeps trading on technicals, without being influenced by any fundamental. Hence, the gold has a potential to target $1235 and even $1227, if it holds below $1246.