A Swing Trade Idea On Cryptocurrency – ABCD Pattern In Play on BTC!


Traders, as you know, we recently have launched the forex trading signals on Cryptocurrencies. My colleagues are writing on this daily, and our signals hit two consecutive take profits on Ripple during the previous week. In this update, I'm going to share the long-term forecast for BTC.
BTC – Technical View
On the weekly chart, we can see the massively overbought BTC has dropped to place low at $3,010, and that's exactly the same level where it completes 61.8% Fibonacci Retracement. At the same time, it's very likely to form an ABCD Pattern on the weekly chart.
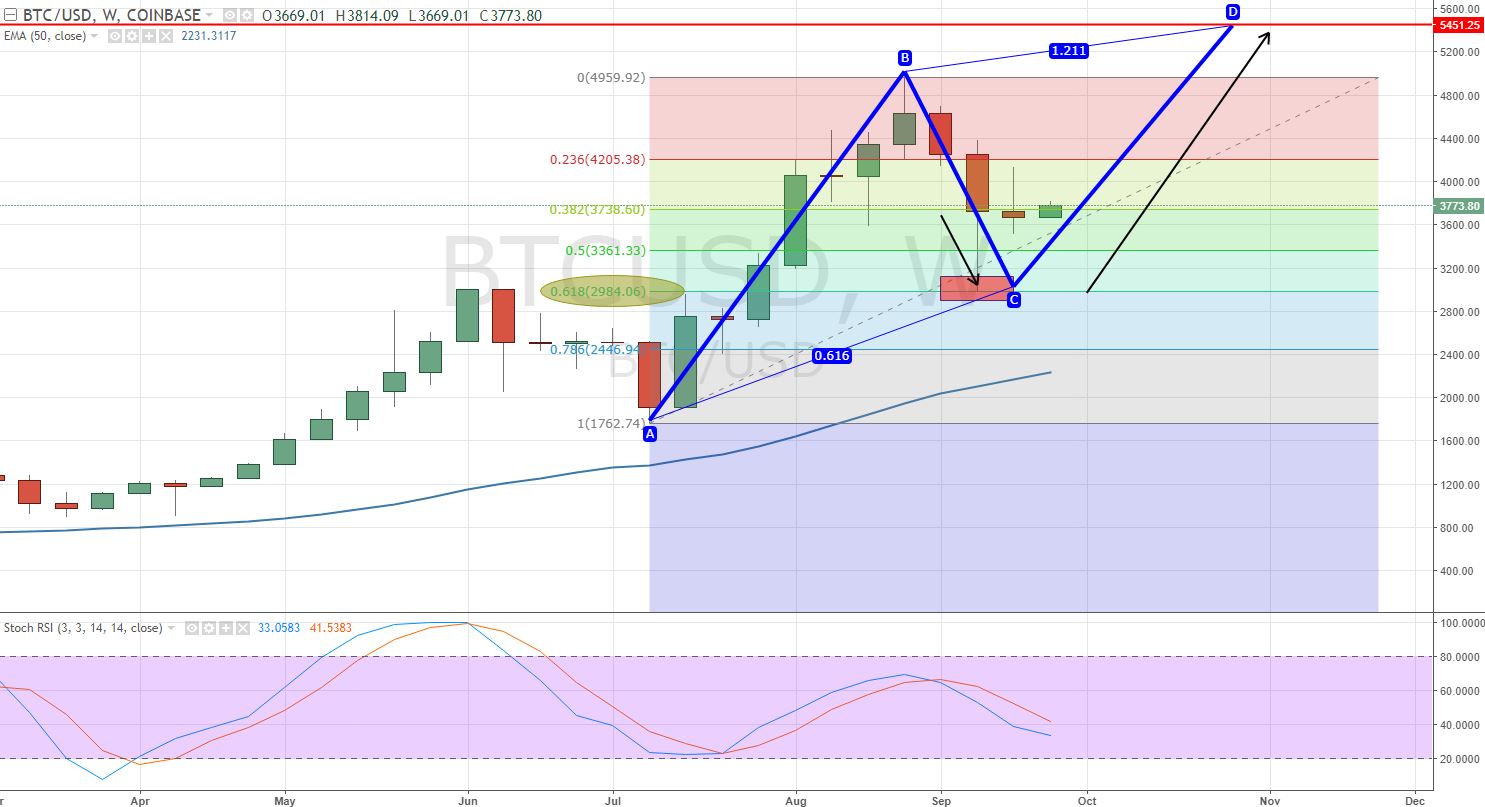 BTC – Weekly Chart – ABCD Pattern
BTC has completed the ABC, whereas C to D pattern seems imminent at $5,451 in the fundamentals remains in favor. The momentum indicator, RSI, and Stochastic are holding in the selling zone.
Last week, the Crypto closed a candlestick pattern Doji followed by bearish candles signaling that sellers are getting weaker, and bulls are likely to dominate the market. In case the candlesticks analysis is new to you, I would recommend FX Leaders Candlesticks Trading Strategy to gain the better understanding and take more profitable trades.
BTC – Trading Idea
Based upon the technical outlook, I would like to stay bullish above $3,361 to target $4,205, $4,950 and ultimately $5,451. Keep in mind this analysis is for long period, and we should use minimum volume to hold positions. Good luck!