As we mentioned in the US session brief, since the massive crash before Christmas, Bitcoin has been making higher lows. If it was up to the sellers, it would have been pushed lower and we would have seen the $10,000 level go by now. From this, we can see that the downside is now over.
That being said, Bitcoin is not making any new highs, either. The highs have been getting lower since it failed to break the $20,000 level. Last week, we saw $16,330 as the price climbed higher after the crash. It was expected that we would see some new highs this week, however, the high came about $1,000 lower and we only saw $15,300 today.
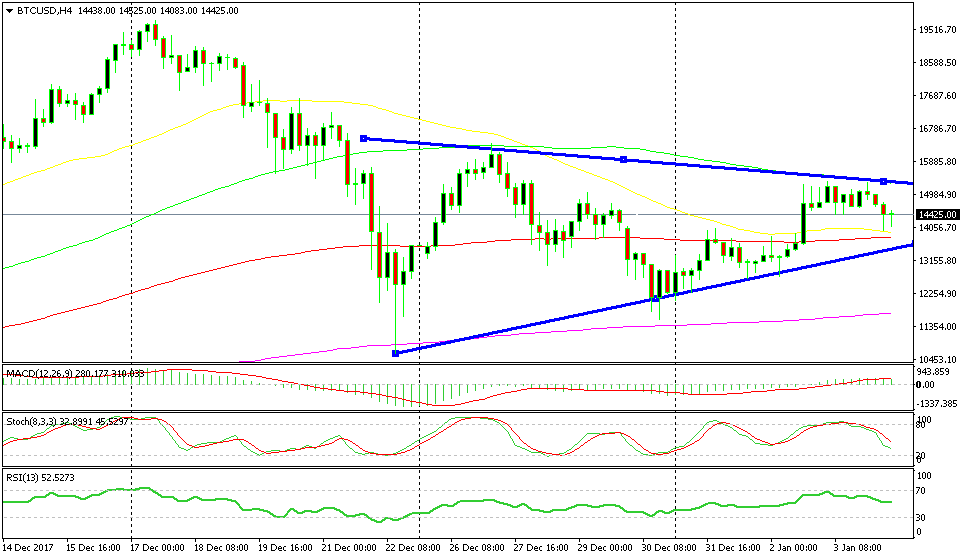
A big triangle has formed in Bitcoin
When the highs get lower and vice versa, a triangle should be forming. We missed that triangle in the previous post, however, it can be seen on the H4 Bitcoin chart (above.)
This triangle can no longer be traded, because it is getting more narrow and the spreads don’t justify it. This triangle is a good pattern to spot breakouts in either direction. If the price moves above or below the lines, it signifies that a break is starting to take place.
It is my prediction that the break will be on the upside. Most of major cryptocurrencies are making new highs, so it can be assumed that the Bitocin will catch up. The moving averages are providing support at the bottom, so they point up as well- however, we will have to wait for the break to happen first.