All Eyes are on the FED this Week. The Highly Anticipated December Interest Rate Decision is due on Wednesday!


The US dollar has performed rather well in the last few months. Was this bull-run part of a ‘pricing in’ of another Federal Reserve interest rate hike this month? While the Greenback has been strong, some of its major counterparts have felt the pain of relentless short-selling. The Japanese yen is a good example, with a massive 1630 pip loss against the US dollar since June this year. Since the US presidential elections in November, the Euro has also lost a lot of ground against the US dollar. Let’s look at a daily chart of the US dollar index:
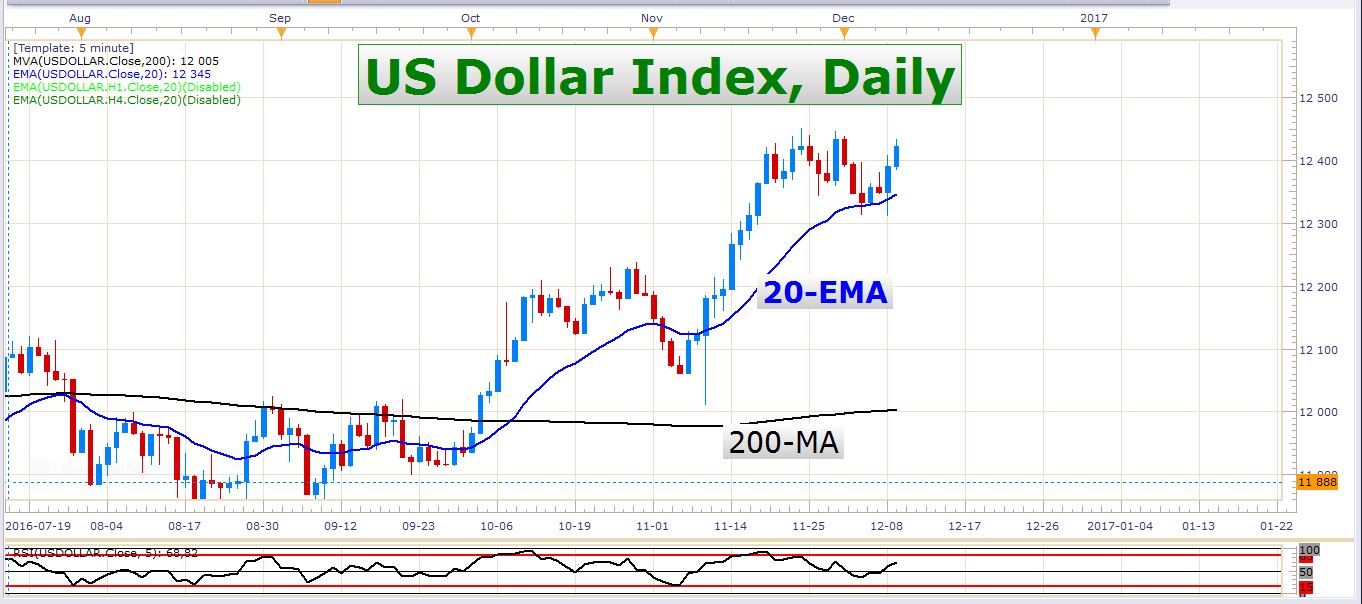 US Dollar Index Daily Chart
This index is a composite of the US dollar against four major currencies – the Japanese Yen, Euro, Pound, and the Australian dollar.
This index is still very bullish, and gauging by the technicals it could still advance much further in the near future. In the chart above we can clearly identify a bull-flag pattern which is a continuation pattern and points to further US dollar gains.
USD/CAD
This pair has not reflected the recent US dollar strength. The Canadian dollar has outperformed the US dollar convincingly over the last 19 trading days. Look at the following chart:
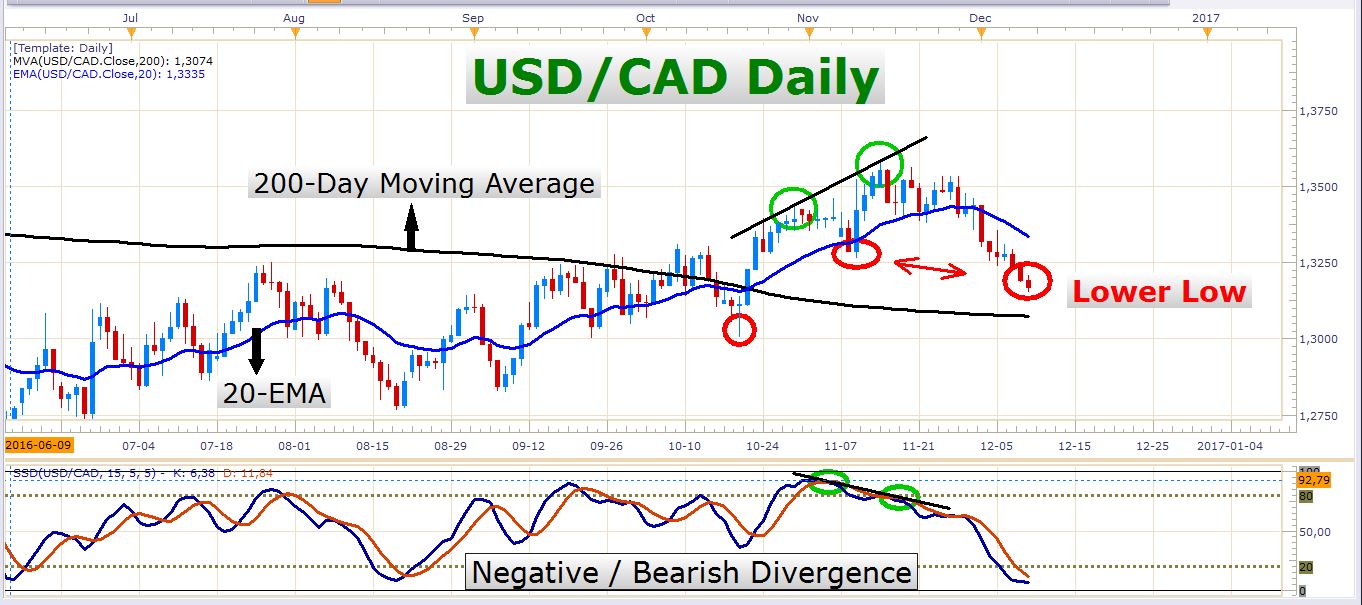 USD/CAD Daily Chart
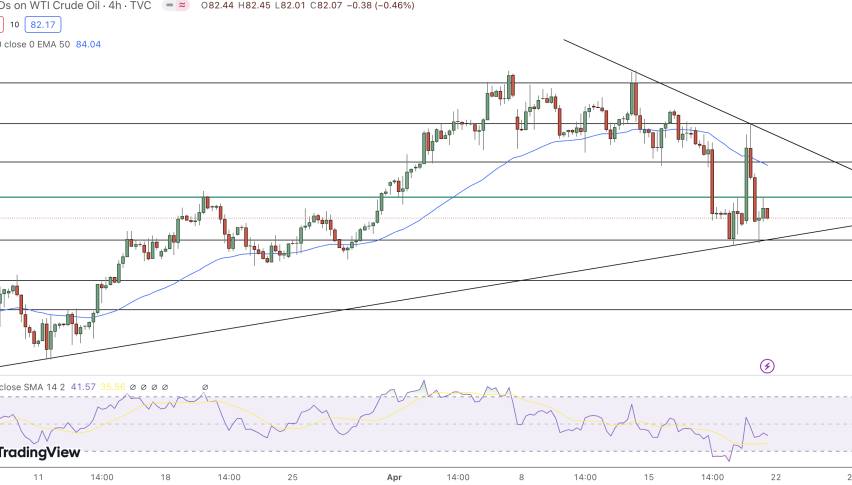
The solid break below the 20-day exponential moving average is a good indication of the strength of the Canadian dollar. Maybe you might wonder what all the fuss is about, but if you consider how strong the US dollar has lately been against the other major currencies, the fact that the Canadian dollar has been able to push back the US dollar like this is really impressive. A lot of this Canadian dollar strength is a result of the impulsive rally in the oil price. As you might know, this bounce in the oil price is a result of the recent pact between OPEC and other oil producing countries to cut oil production. For just how long this rise in the oil price will continue, is difficult to say, but as long as this commodity gets more expensive, the Canadian dollar will be a beneficiary of its advance. Here is a 4-hour chart of the USD/CAD for a closer look at how strong the Canadian dollar currently is:
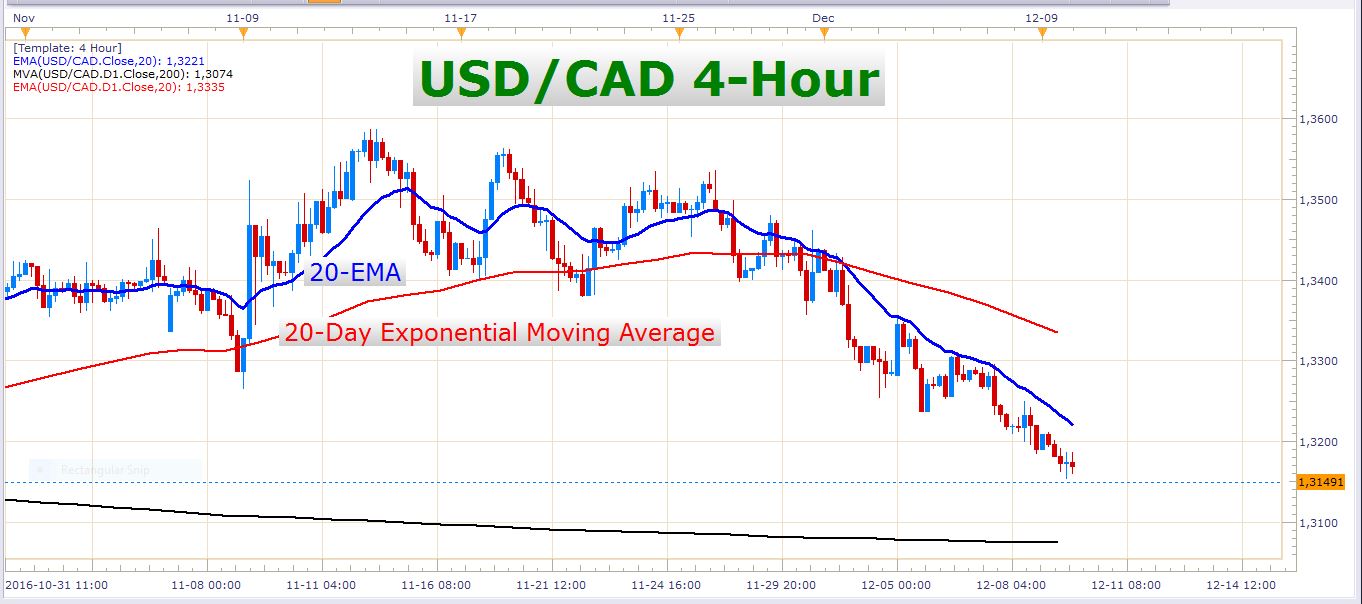 USD/CAD 4-hour Chart
GBP/USD
Although the FED’s rate decision will definitely take center stage this week, there is another important interest rate decision on this week’s docket. On Thursday, the Bank of England have will decide on whether the current 0.25% is still acceptable. Let’s look at some pound price action:
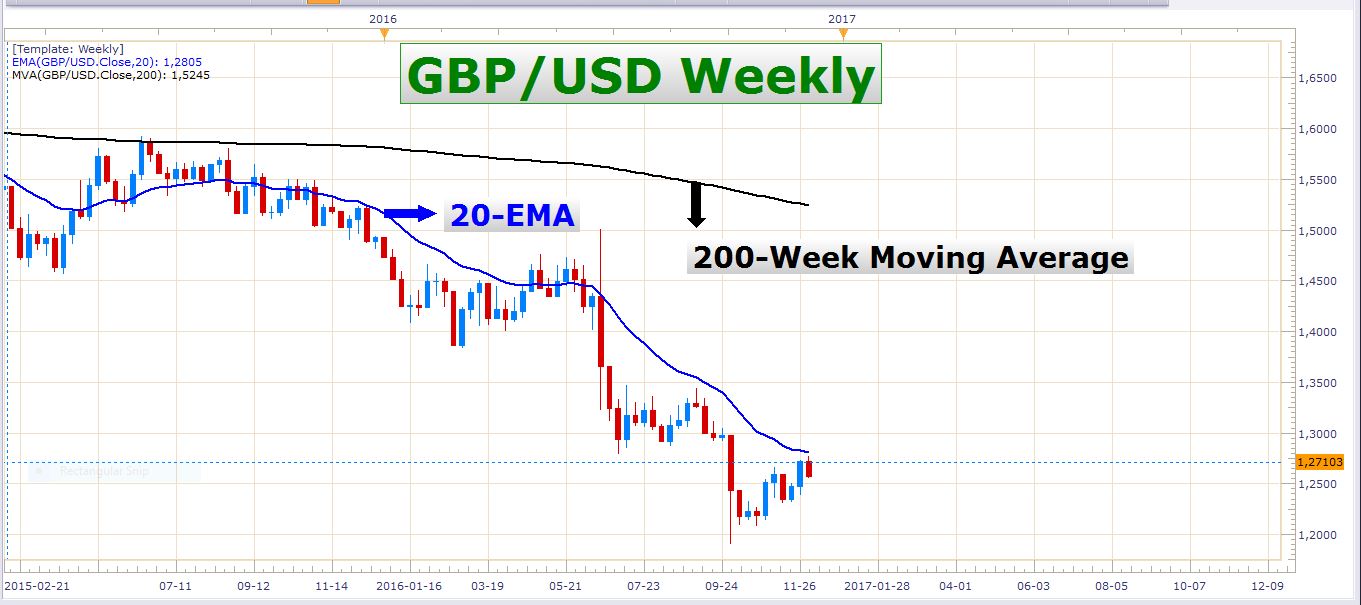 GBP/USD Weekly Chart
On this long-term chart, there is no doubt about the direction of the current trend. The sellers are firmly in control, and the downtrend is still healthy. Why do I say this? The pair has not broken the pattern of lower swing highs and lower swing lows yet. Besides this, the price is still holding below the 20-week exponential moving average.
The Bank of England has recently expressed its concern about the weak British pound and its effect on the UK’s inflation outlook. This is a matter that could compel the BOE to raise interest rates sometime. Since they’ve mentioned the risk of higher inflation, the pound has strengthened, however. Perhaps this mild appreciation in the pound has cooled down the BOE’s inflation fears somewhat, which could postpone their first interest rate hike. Here is a daily chart of the GBP/USD:
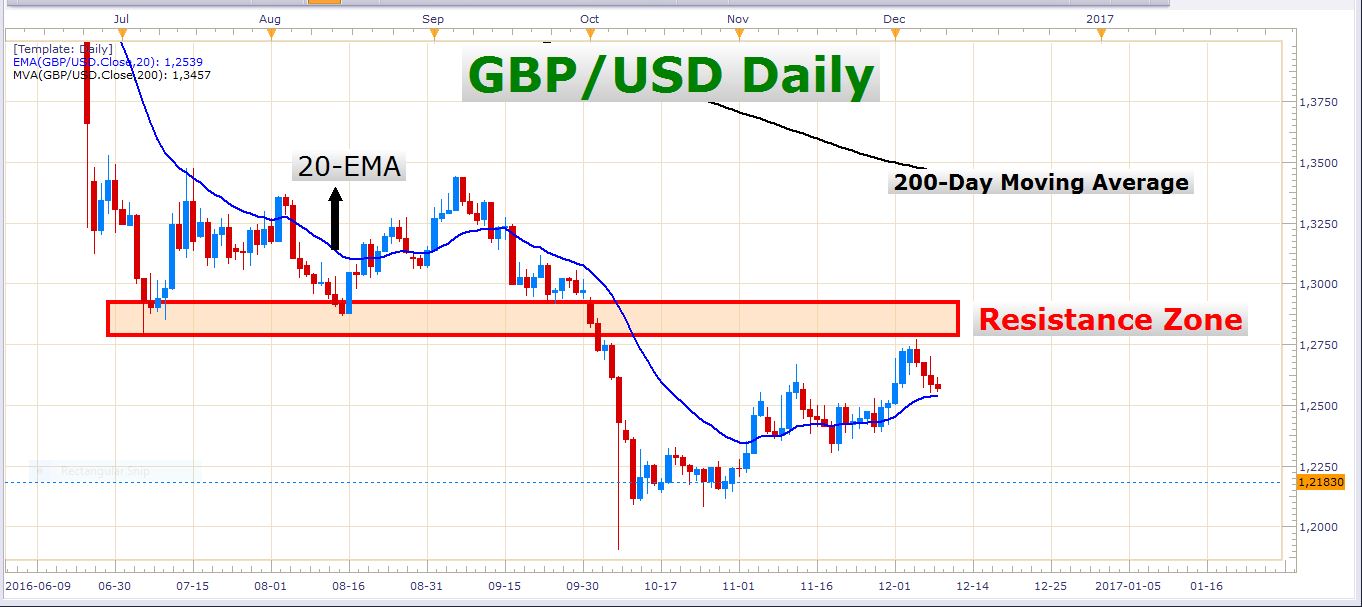 GBP/USD Daily Chart
Here you can witness the power of a former support zone which has turned into a zone of resistance. As expected, the pair met some sellers close to the red resistance zone on the chart above. Whether this zone will hold or not, is difficult to tell, but if it does, the exchange rate could soon print lower highs and lower lows on a daily timeframe. These could perhaps bring down the pair to the yearly low at 1.19048.
EUR/USD
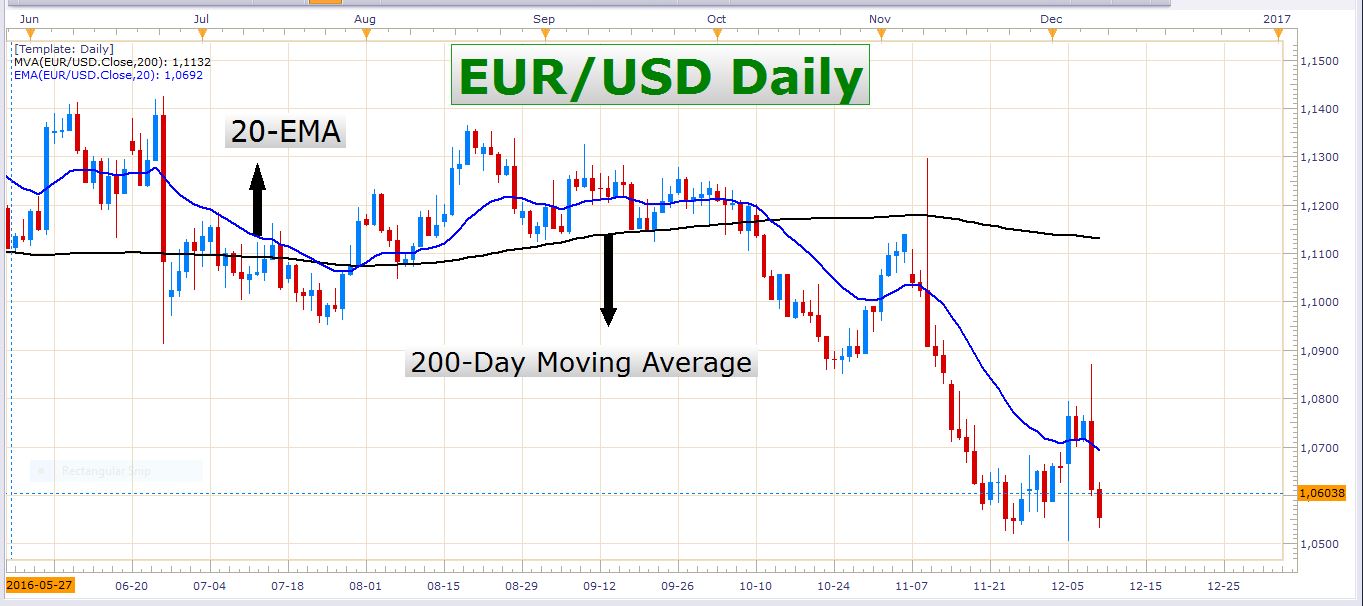 EUR/USD Daily Chart
The EUR/USD is trading below its 20-day exponential moving average again. The ECB’s interest rate decision last week caused some tremendous volatility. The initial reaction was a strong bounce which soon turned into a massive decline. The Euro still needs to overcome several fundamental hurdles, and the technicals also suggest continued weakness.
A FED rate hike on Wednesday would probably have the effect of initial US dollar strength. Whether there will be a lot of follow through by the bulls is uncertain. The market has had more than enough time to price in a rate hike by the FED, and perhaps the dollar is somewhat overpriced at the moment. Nevertheless, the US dollar is in a strong uptrend and we need to stick to a bullish bias as long as the Buck moves higher.
My outlook for the Euro is negative, and I would like to see the EUR/USD print lower lows on the daily timeframe soon. Selling this pair has yielded good results for many weeks already, and I think it could easily yield some more returns in the days and weeks to come.
Monday has no important economic data releases. I don’t expect massive moves in the currency market, especially with the FED’s rate decision on Wednesday. Nevertheless, I will be ready for anything, as usual. You never know when an explosive move comes your way in the FX market so keep your finger on the trigger!
Good luck trading out there!