AUD/USD descending triangle pattern does well – Let’s catch retracement!


The AUD/USD plunged sharply to trade near $0.7070 over a stronger dollar. As we discussed earlier, the US non-manufacturing and ADP employment figures were phenomenal. Which cause a bearish breakout on the descending triangle pattern and dragged the AUD/USD pair lower to 0.7065.
But it looks like a time for retracement. Looking at the 4- hour chart, the AUD/USD has entered the oversold zone as the Stochastics is holding below 20. Moreover, the recent candle with a long wick demonstrates the neutral sentiment of investors.
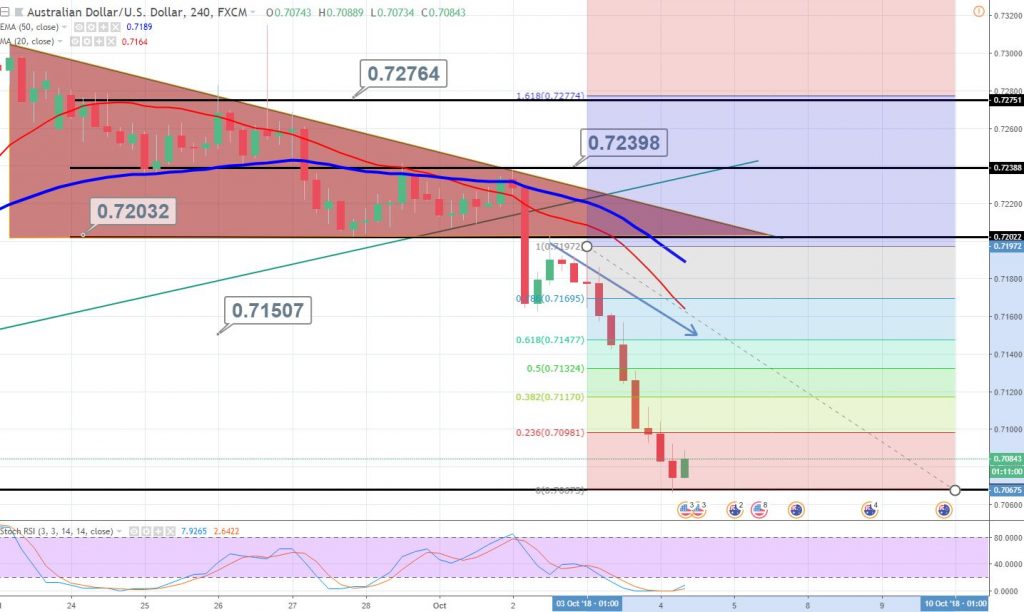
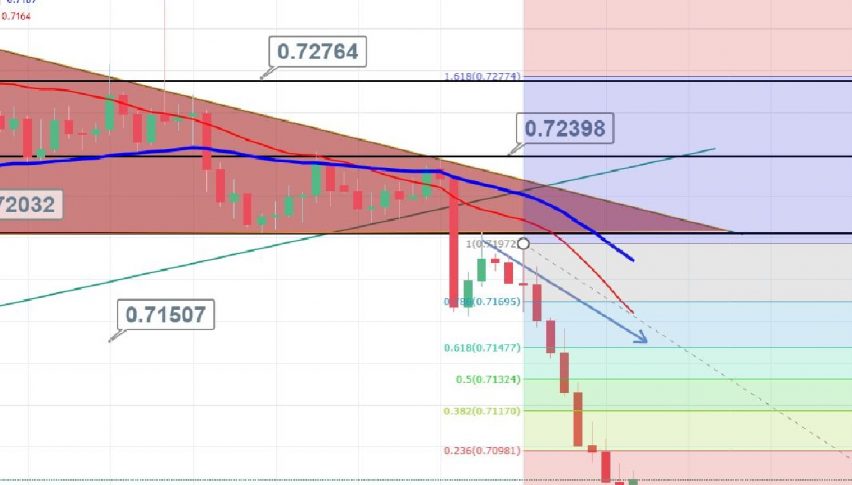
AUD/USD – 4 Hour Chart
The Fibonacci indicator shows an immediate resistance at 23.6% Fibo level of 0.7098 and 38.2% level of $0.7115. Which means, the sellers are exhausted and bulls are looming around the corner.
That’s the reason we opened a buying signal to target quick 30 pips at 0.7114 in the AUD/USD.