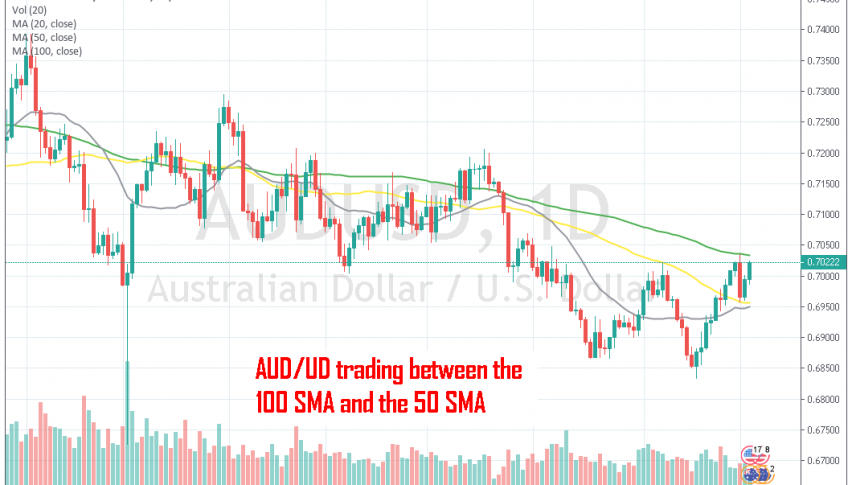
AUD/USD Is Trading Between 2 MAs on the Daily Chart


AUD/USD has been on a bearish trend since Spring of 2018 when the global economy started weakening after the trade war between US and China started. That hurt the market sentiment which is a negative thing for risk currencies such as the Aussie and on top of that, it has affected the Australian exports which in turn hurt the Australian economy.
The economic slowdown has picked up in Q2 of this year and the trade war has escalated, which have turned the Reserve bank of Australia (RBA) extremely bearish. The RBA has cut interest rates twice in the last two meetings, so the Aussie doesn’t have any reason to rally.
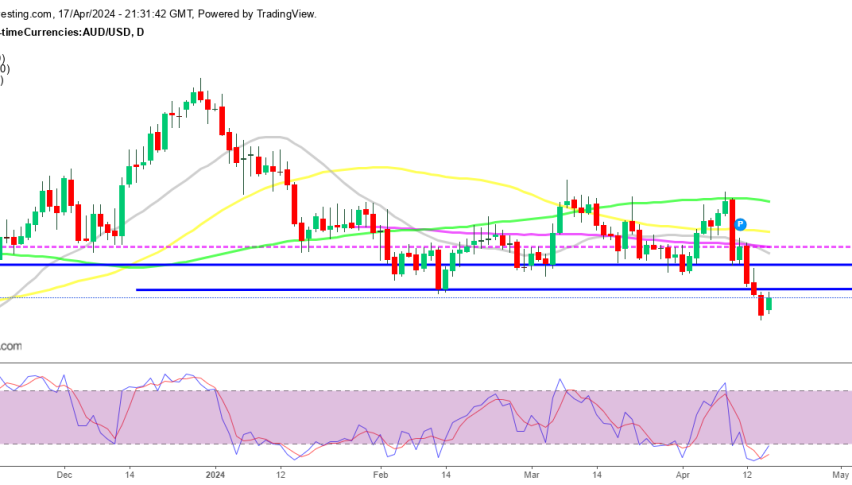
But the rate cuts are also a reason for AUD/USD to rally. The RBA let us know in their statement on Tuesday that they will pause for some time with rate cuts, which has turned the Aussie bullish, at least for the time being until they turn dovish again. So, AUD/USD has been bullish since the middle of last month, but the buyers failed to take out the 100 SMA (green) on Monday.
The price reversed from that moving average and lost around 80 pips, but the 50 SMA (yellow) which has been providing resistance for this pair, now turned into support. The price bounced off the 50 SMA and now it is heading for the 100 SMA again. it might even break the 100 SMA this time as the USD has turned bearish again and the AUD is finding some strong bids. But if we see the price hesitate at the 100 SMA again, we might open a short term sell signal there, trying to get some pips in the first rejection.