

Weekly Chart Setup in USDX
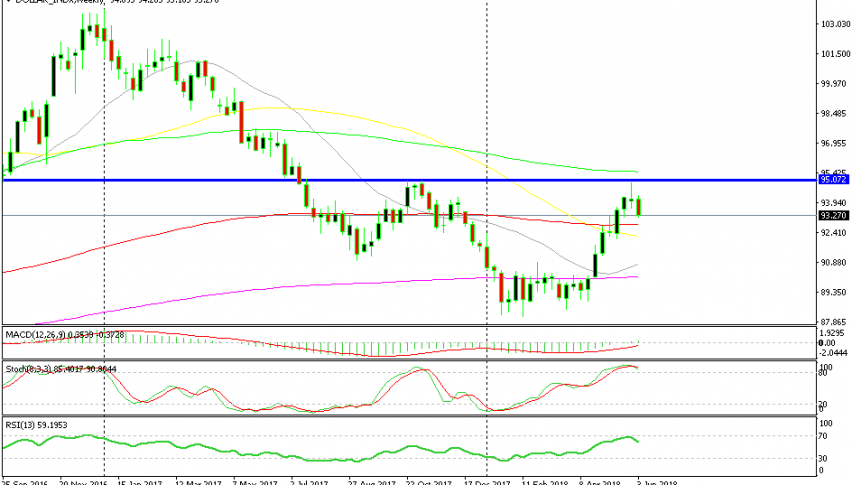
The USD index, or the USDX as it is presented, turned bullish by mid-April. Since then, it traded in a solid bullish trend for several weeks. But now, we can see a bearish chart formation start to form on the weekly time-frame.
As you can see from the chart above, the USD index made a decent climb from 89 points to 94.95. But it stopped short of the 95 level. That level provided resistance back in October and November last year. It seems the buyers were aware of it because the climb stalled and the price reversed just below that level.
So, the area around 95 is working as resistance now. That’s the first bearish sign in the Dollar index. The other bearish sign comes from stochastic and RSI. Both these indicators reached overbought levels last week, but are now turning down.
Although, the biggest bearish sign here is the candlestick pattern. Last week’s candlestick closed as a doji. The doji is a reversing signal. But the pattern is not complete without a bearish candlestick the following week. The following week is the current week which is about to close soon and it looks pretty bearish.
We can expect the USD to head lower since the chart formation in USDX looks to be turning bearish. This is the technical side of the USD, but the fundamentals have improved recently and they look bullish. So, the plan is to wait for the technicals to unfold and push the USD lower, then to buy the USD based on fundamentals.
Translating the Index Into Forex Pairs
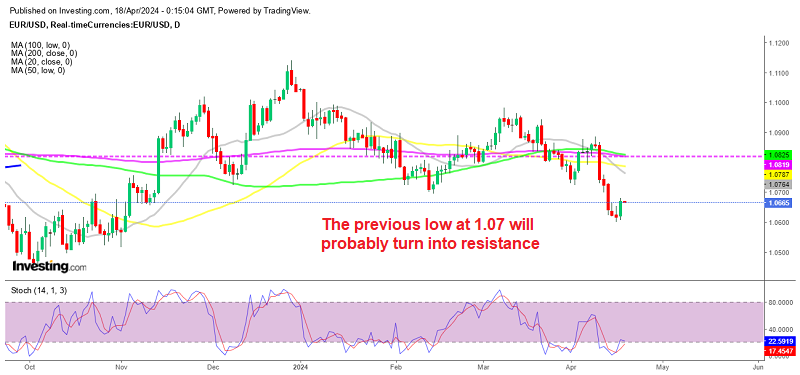
EUR/USD is trading above 1.18 today and 1.20 doesn’t look too far. If technicals are to work, EUR/USD should be able to reach 1.20. By then, the USDX will be oversold hopefully, which would be a good time to look for EUR/USD shorts.
A similar picture is also emerging in GBP/USD. This forex pair is trading at 1.3440s at the moment. The zone around 1.3600-50 is a major resistance zone. If the USDX continues to fall, GBP/USD should continue to climb. When GBP/USD reaches that resistance zone, we will get back to you with another analysis probably followed by a long term sell forex signal.