Bitcoin Breaks the Triangle to the Downside, but There’s One More Obstacle on the Way for Sellers


Cryptocurrencies had quite a bullish quarter in Q2 of this year. During Q1, altcoins traded mostly sideways, with BITCOIN bouncing between $3,000 and $4,000 for a few months. That came after the major decline in 2018, when Bitcoin fell from below $20,000 to $3,000, pulling so that was a sign that sellers were done and a reversal would follow in the coming months most probably.
That’s exactly what happened; Bitcoin finally broke out of the range and pushed above $4,000 and then above $5,000, which really discouraged the sellers and encouraged the buyers, improving the sentiment in the whole crypto markets. Then, the resistance levels started giving up one after another and Bitcoin broke above the big level at $10,000 and reached to $13,850 towards the end of June.
But, it hasn’t made new highs since then. In fact, the highs have been getting lower since then, which is a sign that buyers were getting exhausted, giving up sooner on their attempt to push the trend higher each time. But the sellers couldn’t take things on their hands either, with Bitcoin forming a base at $9,000, so that area became a support zone, which has lasted for the last three months.
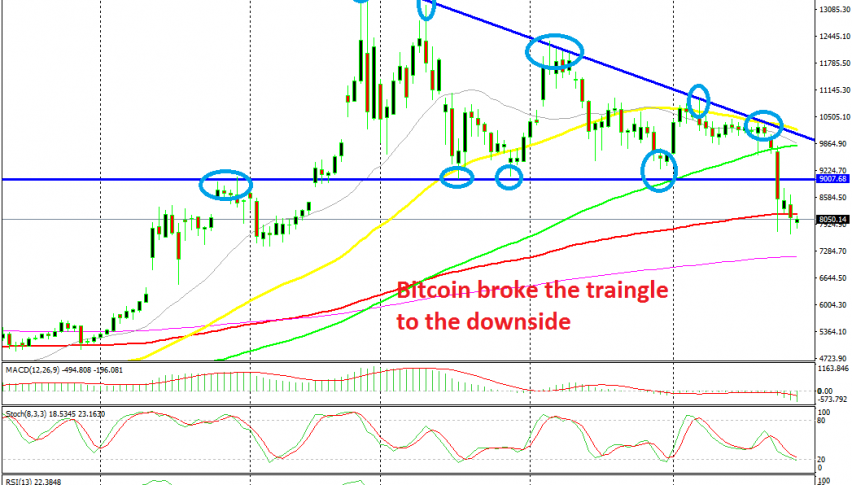
As a result of that sort of price action, a wedge formed which was progressing into a triangle, as shown in the above daily chart. In such cases, the break could be in any direction, but the downside is more in risk since the sellers kept coming in earlier each time the buyers failed to make new highs. Besides that, the 50 SMA (yellow) turned from support into resistance during September, which was another sign that the upside momentum was fading and the sellers were gaining control.

The 100 SMA stopped the decline for Bitcoin
Then on Tuesday the big break came. The support zone around $9,000 was finally broken, so the triangle has been breached. The 100 SMA (red) on the daily chart has been breached as well, which opens the door for further declines. But, if we switch to the weekly chart, we see that the decline stopped right at the 100 SMA (green). This hasn’t exactly been the ultimate support/resistance indicator for Bitcoin, but it stopped the decline.
Now, this moving average becomes the next target for sellers. We might see a bullish reversal from here or a break, so we will follow the price action around the 100 SMA which stands at $7,460s. If we get a bullish reversing signal at the 100 SMA, such as a doji or pin candlestick, then we might decide to go long on Bitcoin.