Bitcoin Slips Below the 50 SMA on the H4 Chart but the 100 SMA Remains on the Daily Chart


The H4 Timeframe Chart
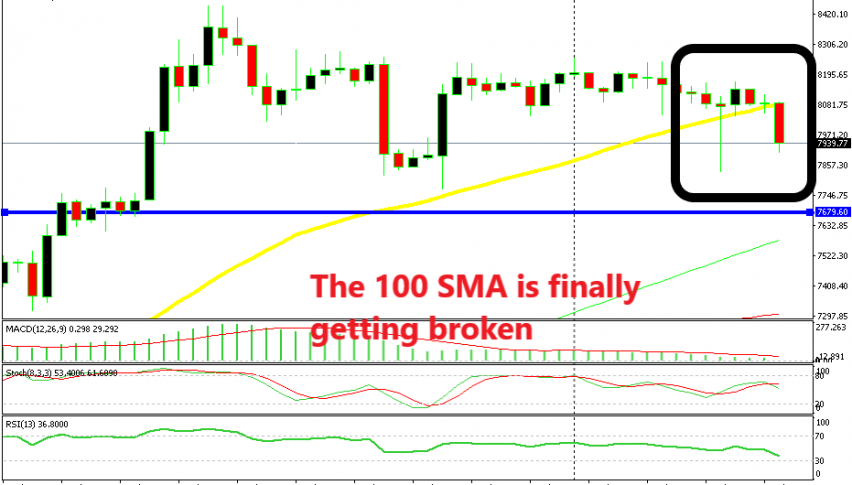
Yesterday we spoke about Bitcoin and the fact that the 50 SMA (yellow) was holding pretty well on the H4 chart. Bitcoin had been on a bullish run for quite some time and the rejection at the 50 SMA after the retrace lower late last week, looked pretty bullish too. After the bears tried that moving averages, the buyers became active again and Bitcoin jumped around $500 higher.
Yesterday, the sellers made another attempt to the downside and they pierced the 50 SMA briefly. But as we know, the break is not a proper break until the candlestick closes below/above the moving average or a support/resistance level.
That was a bearish and a bullish sign at the same time. It was bearish because it showed that the sellers were far from dead and well in play since they were trying the downside for the second time in a few days. It was a bullish sign as well because the H4 candlestick closed as a hammer, which is a reversing signal and the 50 SMA held again.
That should have scared the sellers but here we are again, below the 50 SMA today. Although the candlestick is not closed yet, it looks like it will close below the 50 SMA today.
The Daily Timeframe Chart
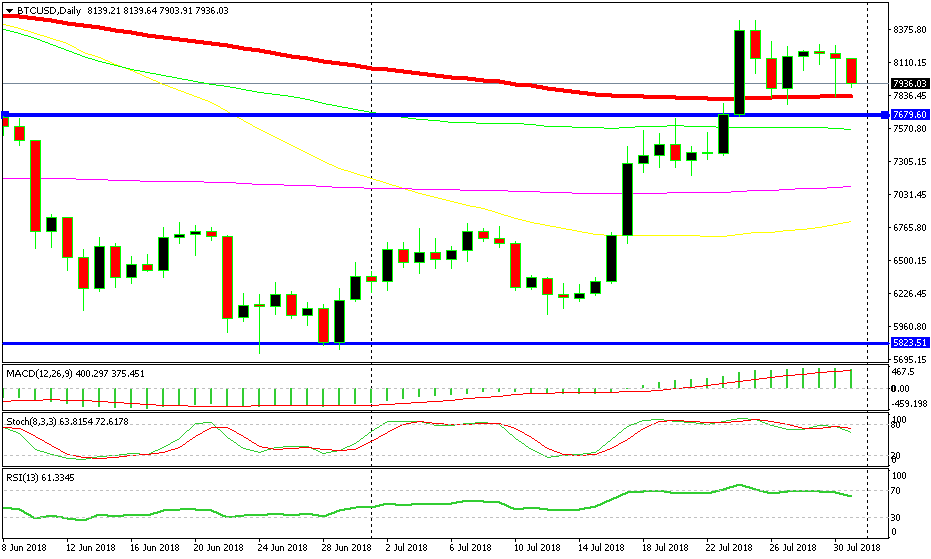
The 100 SMA still survives in the daily chart
Switching to the daily chart, we see that the sellers have another obstacle in the way. That obstacle is the 100 SMA (red). As you can see, the sellers have tried to push below the 100 SMA three times in the last several days, but they have failed to break it.
Today we seem to be heading towards that moving average again. The 100 SMA stands $100 lower at $7,800s. The stochastic indicator is overbought and it is turning lower, which means that a decent retrace lower is due for Bitcoin on the daily chart.
But, the 100 needs to be broken, which would mean that the daily candlestick should close below it. So, until it happens, Bitcoin is still bullish. Besides that, the selling seems to have stopped now because sliding has stopped and the price has been trading around the current levels for about an hour. So, if the 100 SMA gets broken, then Bitcoin will enter a bearish phase. If it jumps off of here, then the bulls are still in control.