Bullish Breakout In WTI Crude Oil – Is It Good Time To Buy?
This week, the Crude Oil has traded sideways in the same trading range recommended in our earlier updates. But today, the Oil has formed a
This week, the Crude Oil has traded sideways in the same trading range recommended in our earlier updates. But today, the Oil has formed a perfect trading setup to trade the EIA inventory reports today. Let's check it out…
EIA Crude Oil Inventories
Yesterday, we had to close our Forex trading signal on Crude Oil at 2 pips loss as the EIA reported a build of 4.6M barrels supplies. The build was expected to be 2.8M but the increase in supplies boosted concerns over the demand for the Crude Oil.
So, later it proved to be a good decision as the price sharply fell to our stop loss level. As I always advised, we should move our stops at breakeven once the trade is in the profit of 20-25 pips. To be safer, we can close our partial position when the trading signal travels half of the way to target.
Technical Outlook
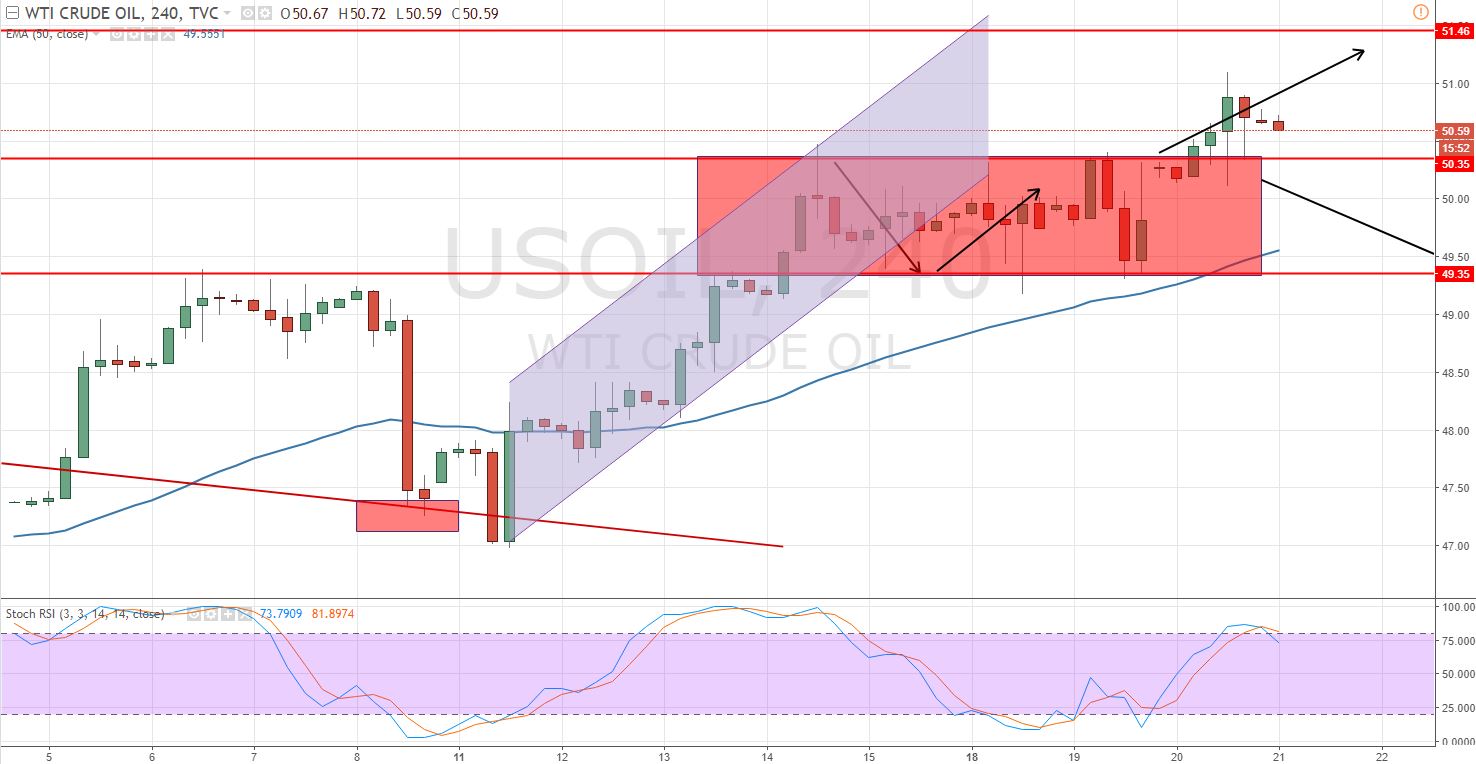
Looking at the 4-hour chart, the Crude Oil has broken above the previously identified trading range of 100 pips ($49.30 – $50.30). Oil kept on consolidating in the same range for a couple of days, and now it has broken out of the range.
 Crude Oil – 4 Hour Chart – Sideways Trend Breakout
For now, the immediate support prevails at $50.30 and that's where I would like to take a buying entry today. On the higher side, $51 and $50.45 seems to extend a good resistance.
Crude Oil Trading Plan
I'm placing my buy limit at $50.30 with a target of $50.85 and $51 with a stop loss below $50. Good luck.
- Check out our free forex signals
- Follow the top economic events on FX Leaders economic calendar
- Trade better, discover more Forex Trading Strategies
- Open a FREE Trading Account
 Crude Oil – 4 Hour Chart – Sideways Trend Breakout

