
⚡Crypto Alert : Altcoins are up 28% in just last month! Unlock gains and start trading now - Click Here
Bullish Turn In Crude Oil – Can Doji Candles Help?


Oil prices slid as trade tensions and troubled emerging markets notched the outlook for fuel demand, though U.S. sanctions against Iran aimed towards tighter supply ahead.
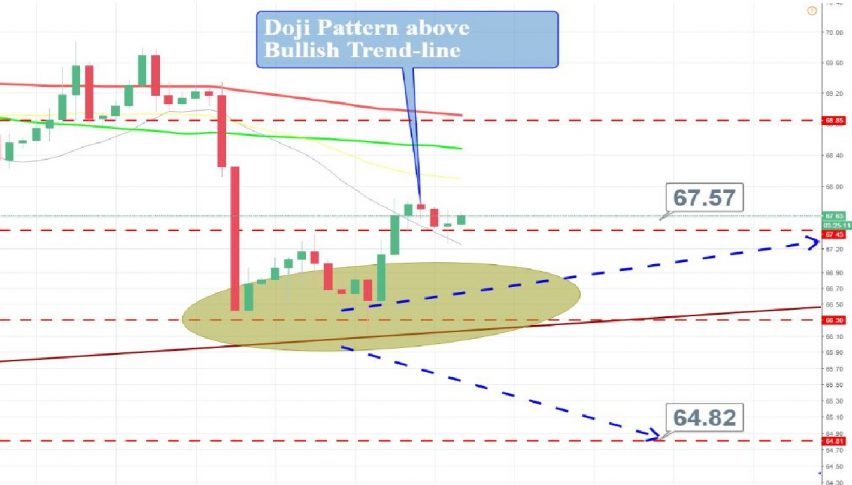
For the moment, crude oil is facing a strong support near $67.50, and above this, the market can go for further buying trend.
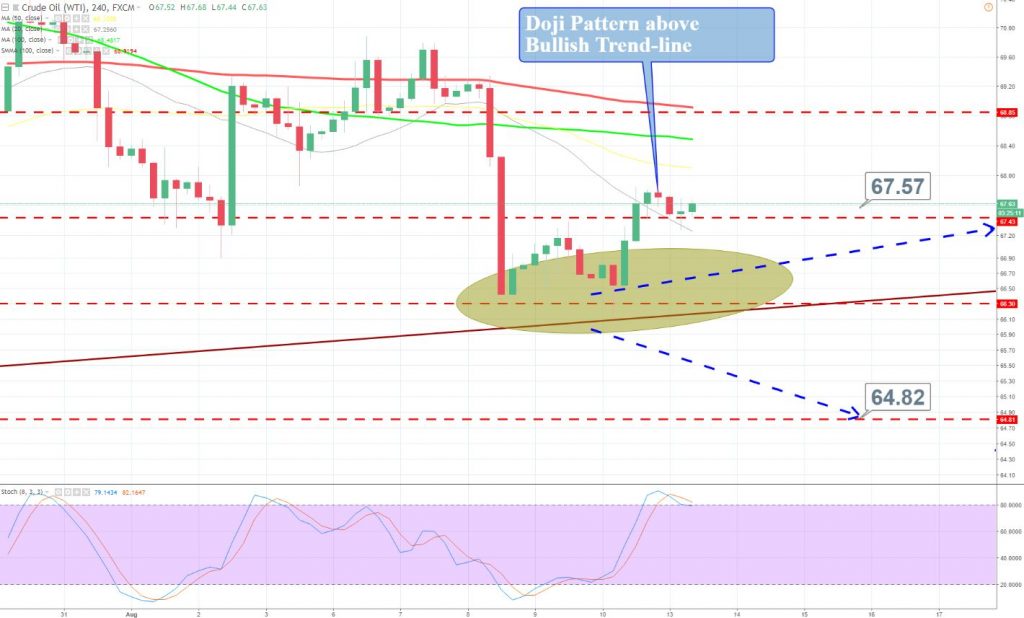
WTI Crude Oil – 4 Hour Chart
The immediate resistance is likely to be at $68.10 and $68.65. Whereas, the support prevails at $66.75 and $66.30. If you are interested in weekly trading levels, check out our recent update.
For today, taking buying positions only above $67.50 seems to be a good idea.
Check out our free forex signals
Follow the top economic events on FX Leaders economic calendar
Trade better, discover more Forex Trading Strategies
Related Articles


Comments
Subscribe
Login
0 Comments


