

USD/JPY has been trading on an uptrend for the last three weeks. This pair has been pretty bearish since the beginning of the year, but it formed a reversal in the last week of March and the trend has turned bullish since then.
Last Friday though, USD/JPY started retracing down. The retrace is continuing today as well but I think that the retrace lower might have reached its limits. As you can see from the Hourly USD/JPY chart below, this pair has reached the 100 SMA (green) and it seems like that moving average is not letting go.
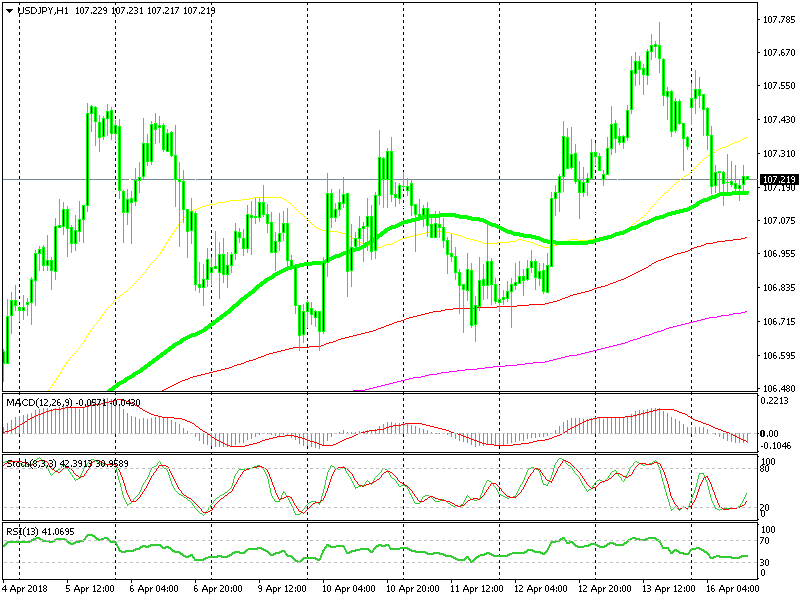
The 100 SMA has been doing a good job providing support
The 100 SMA has been holding on all morning, so it is providing solid support. The stochastic indicator has been oversold and it is now reversing higher. According to this chart, the retrace is complete and the uptrend is about to resume.
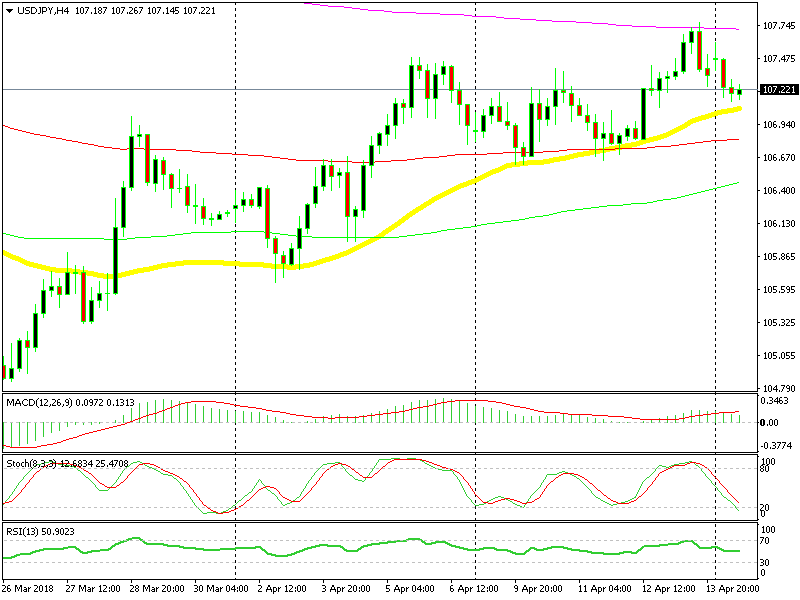
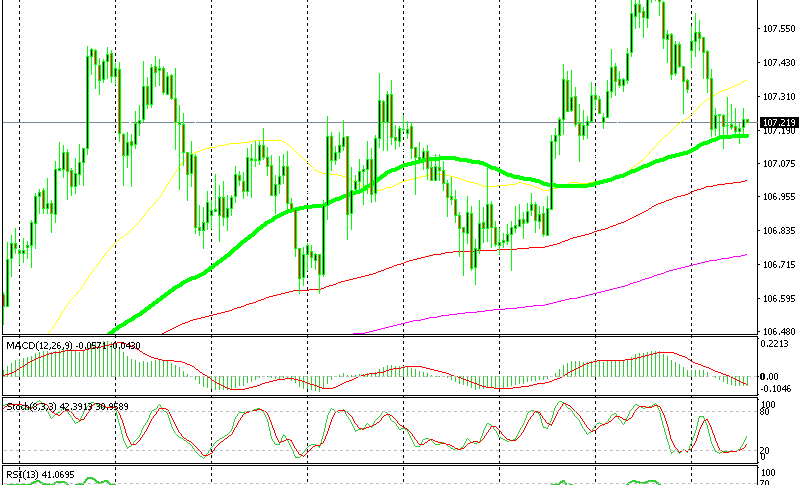
The H4 chart has just become oversold too
If we switch to the H4 chart, we see that the stochastic indicator has just reached oversold levels as well, which means that the retrace is also complete on this timeframe. Besides that, the 50 SMA (yellow) is standing just below there: this moving average has provided support and resistance before, so it is likely to do the same again. The market sentiment is still positive which is bullish for this pair and we decided to pull the trigger. We placed the stop just below the 100 smooth MA (red) while the take profit target is below the 200 SMA (purple).