Crude Oil Tests 50 & 100 EMA – Investors Brace for a Buy Trade


During the early Asian session, WTI crude oil prices fell to extend the losses from the previous session, mainly due to official data that showed US crude and gasoline stocks beat expectations as production hit the record. Meanwhile, Sino-US tensions escalated once again after US President Donald Trump signed two bills backing Hong Kong protesters into law.
US West Texas Intermediate crude fell 24 cents, or 0.4%, to $57.87, after falling 0.5% in the previous session. Crude inventories in the United States increased 1.6 million barrels last week because production hit a record high of 12.9 million barrels per day (BPD), and refinery runs slowed, the Energy Information Administration said. Analysts in a Reuters poll had forecast a drop of 418,000 barrels.
WTI crude oil prices had increased this week due to expectations that China and the United States, the world’s two biggest crude users, would soon sign a preliminary agreement, putting an end to their 16-month trade war.
In the United States, energy services company Baker Hughes reported that US oil drillers reduced the number of drilling rigs for a record 12 months in a row.
While China has repeatedly warned the US administration against interference in their personal affairs, President Trump’s move will likely hurt the relationship with China at a time when both sides are trying to reach a “phase one” trade deal.
WTI Crude Oil – Technical Outlook
On the technical front, WTI crude oil is trading at 58.40, after testing the crucial support level of 57.65 level. The support is extended by bullish trendline as well as the violated resistance level, which is now working as a support for crude oil.
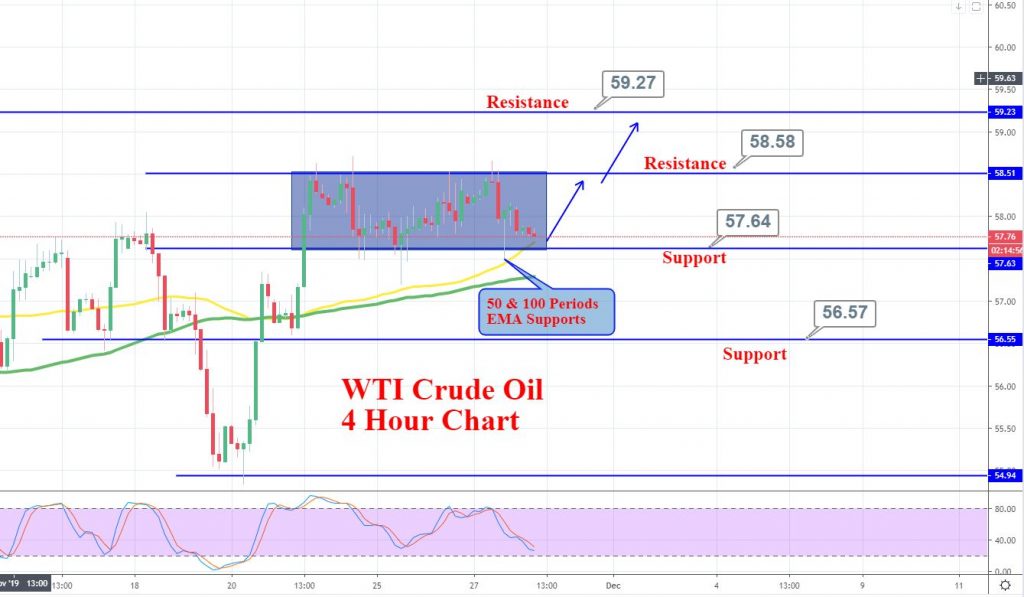
Crude oil has formed a long bullish candle that is engulfing the previous candles, exhibiting strong bullish bias among traders. While the RSI still stays in the bullish zone, above 50.
Daily Support and Resistance
S3 55.78
S2 56.94
S1 57.54
Pivot Point 58.09
R1 58.69
R2 59.25
R3 60.4
Today, the idea is to stay bullish above 57.70 level with a stop loss below 57.40 and take profit at around 58.65 and 58.85.
Good luck!