

GOLD has been absolutely surging since March 20, following the big crash lower during the first half of March, which sent Gold diving from $1,700 to $1,450. But the support at that level held and Gold has been surging since then. The trend was already bullish last year and it even picked up pace during the first two months of 2020.
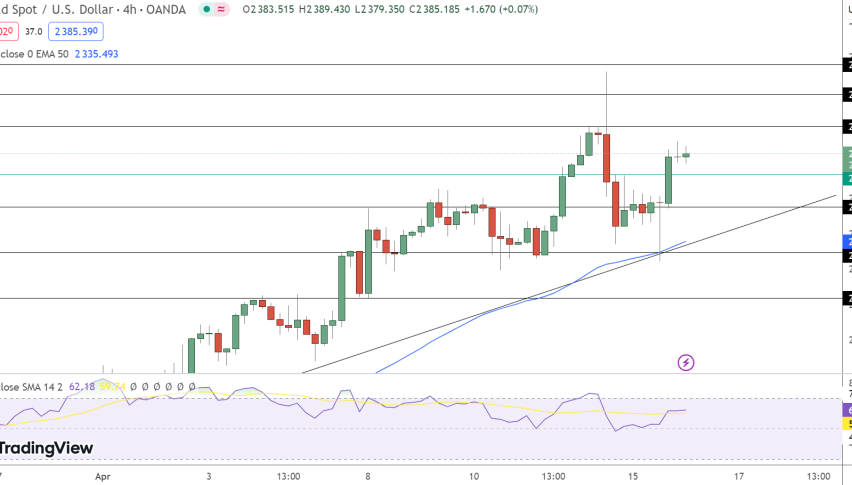
But the surge since mid March has been extraordinary. Gold has climbed from $1,400 to $2,075, which was the print high in August 7, about a week ago. During the bullish trend of the last five months, Gold has been finding solid support at moving averages. The 50 SMA (yellow) provided support once when the trend slowed, while the 20 SMA low (green) and the 20 SMA high (grey) took their turn when the trend picked up pace.
The previous record high at $1,910-20 was broken without much resistance, but the $1,980 level provided resistance for a week or so. Although, that didn’t last too long and Gold pushed higher above $2,000. The strong bullish move is attributed to the increased demand for safe havens, due to the increased uncertainty, as well as from the USD weakness of the recent months.
But, on Friday last week, Gold reversed lower and on Tuesday this week Gold posted what seems to be the biggest one day crash ever, falling around $130 from top to bottom. The decline stretched further down during the next morning, but Wednesday’s candlestick closed like a big doji, which is a bullish reversing signal, after the decline.
Also, the price closed above the 20 low SMA, so that moving average wasn’t officially broken despite the piercing. The 20 SMA provided support, so a bullish reversing pattern formed and Gold did bounce on Thursday, but the bounce ended at the 20 high SMA and on Friday Gold retreated lower. This puts into question the bullish trend. If the uptrend is to resume, the price should move above the moving averages and make new highs.
But, if it doesn’t move above the 200 high SMA soon, buyers might get discouraged and close some of their long positions, which would spark selling and Gold will snowball down. So, we have to follow the price and see which of the 20 SMAs will break first, because this might turn out to be a big opportunity.