Dramatic Bullish Wave in Crude Oil – What’s going on in the market?


During the London session, WTI crude oil jumped dramatically by 1.24% after Saudi Arabia symbolized it was satisfied with a higher price range ahead of a meeting between principal producing countries in Algeria. According to the news updates, Saudi Arabian officials said they are happy with Brent prices moving over $80 a barrel as markets adapt to the loss of supply from U.S. sanctions.
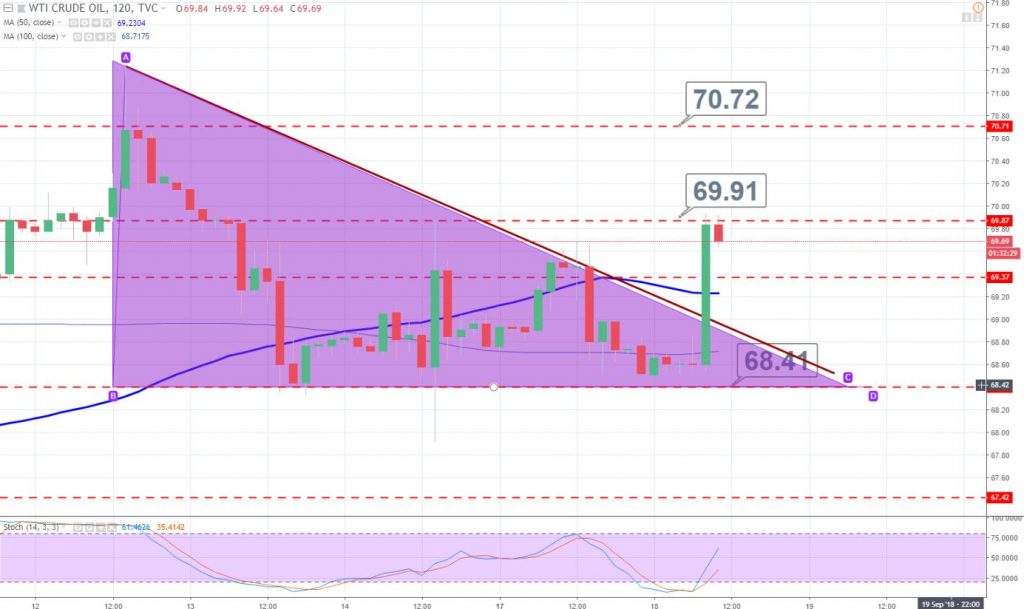
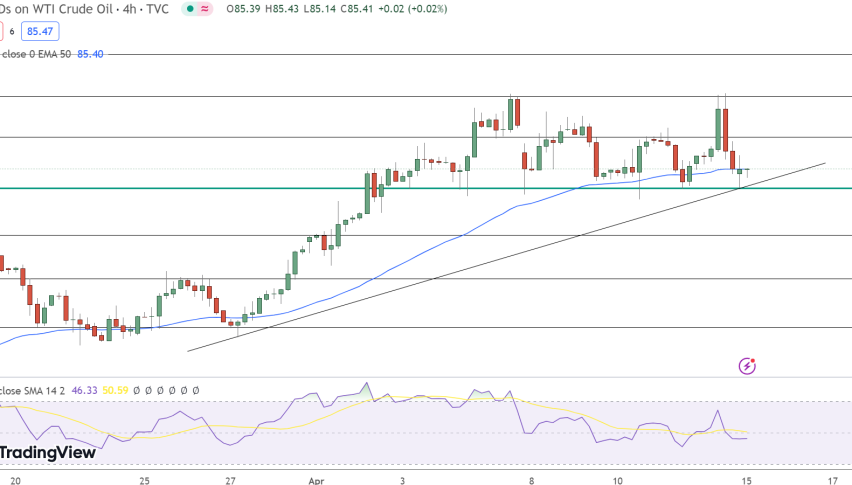
Crude Oil – 2 Hour Chart
The remarks came after the Organization of the Petroleum Exporting Countries and Russia urged that U.S. sanctions against Iran, OPEC’s third-largest supplier, could put weight on the global markets. Iran is already feeling the heat of November 4 sanctions as their exports have started falling.
Support Resistance
68.07 69.25
67.6 69.97
66.42 71.16
Key Trading Level: 68.79
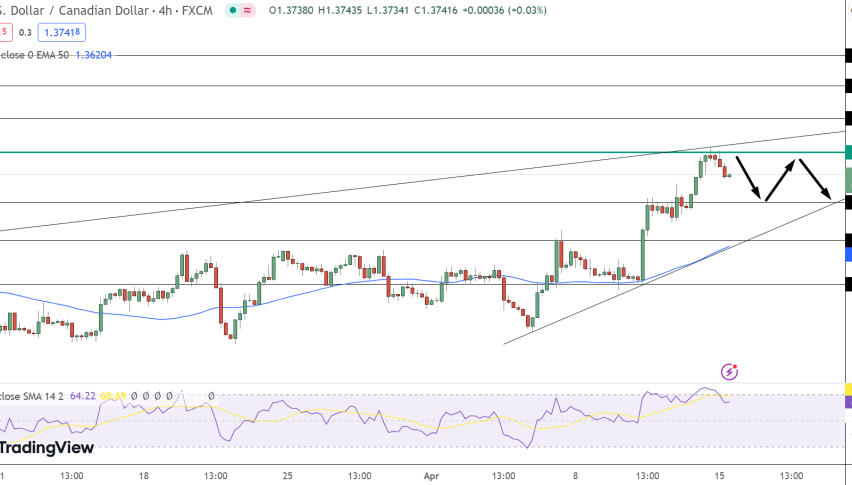
Technically, crude oil has violated the descending triangle pattern which was proving $68.80 a strong resistance. It can drop to $69.30 for a slight correction, but the odds of a bullish trend still remains strong. WTI can face an immediate resistance near $69.95 and $70.75, while the support prevails at $68.40. Good luck!