
Ethereum Completes 38.2% Retracement – Bullish Harmonic Rolling


What’s up, Crypto traders!
The cryptocurrencies have sunk dramatically, with Bitcoin falling more than 50% from its all-time high, as well as Ethereum. Whether you are a leveraged or equity trader, it looks this may be a great opportunity for a buy.
ETH/USD – Bullish Harmonic Pattern
On the 4 – hour chart below, we can see that Ethereum has begun its exit from the oversold zone. The RSI has crossed above the 50, a mid-level defining the trend of the pair. Because the prices are still below 50 – periods EMA, it is not a bullish reversal, but rather a retracement.
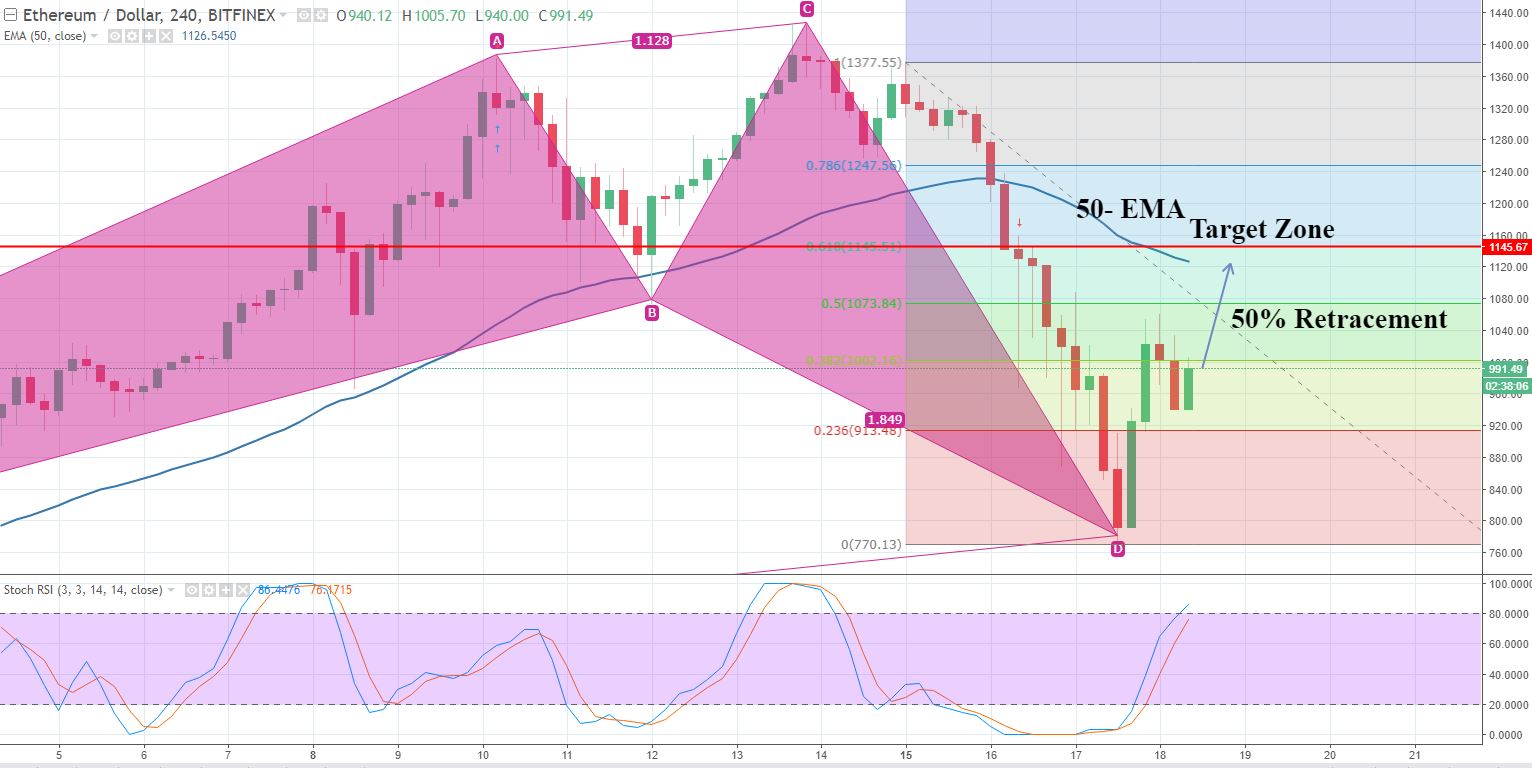
ETH/USD – 240 – Mins Chart
As you can see, the Fibonacci indicator is supporting the Crypto pair at $915.The pair is likely to face resistance at $1,073 (50% Fibo level) and $1,145 (61.8% Fibo level).
Support Resistance
890 1047
732 1144
636 1204
Key Trading Level: 950
ETH/USD – Trade Idea
Investors are advised to remain bullish only above $930, with a target of $1,044 and $1,074. The break above these levels may give us further room for buying until $1,145 is reached. Good luck!