EUR/USD – The 50 SMA is the Line in the Sand for our Signal


Yesterday, we opened a sell forex signal in EUR/USD, just below 1.08. As we have often mentioned recently, this level has been a long term support and resistance level. In fact, the level has been the line in the sand over the last two years – above it, the trading range shifts to 1.08-1.14-15, below it, we´re stuck between 1.08 and 1.05.
As we know, there is always some sort of protection around such massive support/resistance levels. 1.0820 is the last protection for 1.08 and it has proved to be quite efficient in the last two days.
The SL target for our EUR/USD signal is placed above 1.0830, so the 1.0820 has been a guard for our forex signal as well, and we´re not complaining.
In the last few hours though, this forex pair has slipped below 1.08 again and gotten close to our take profit target. However, the 50 SMA (yellow) on the hourly forex chart is holding for the time being.
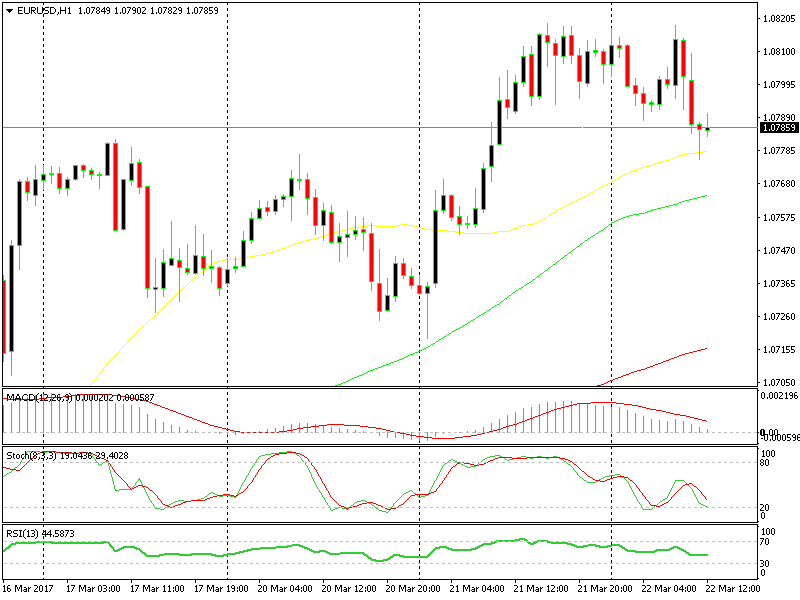 The yellow moving average is going to be a headache for sellers
The downside for our signal is that the hourly chart is almost oversold, with stochastic nearly there. The upside is that the momentum is down right now, and we know that often momentum is stronger than technical indicators.
The price action is telling us that this pair wants to go down, rather than up, because all the rallies have been short lived so far. But, we have to overcome the 50 SMA first, so fingers crossed.