February 10th Morning Brief – Market goes Crazy on Trump


In the early Asian sessions, I figured out a huge fluctuation and overnight changes in the market, particularly in the New York session.
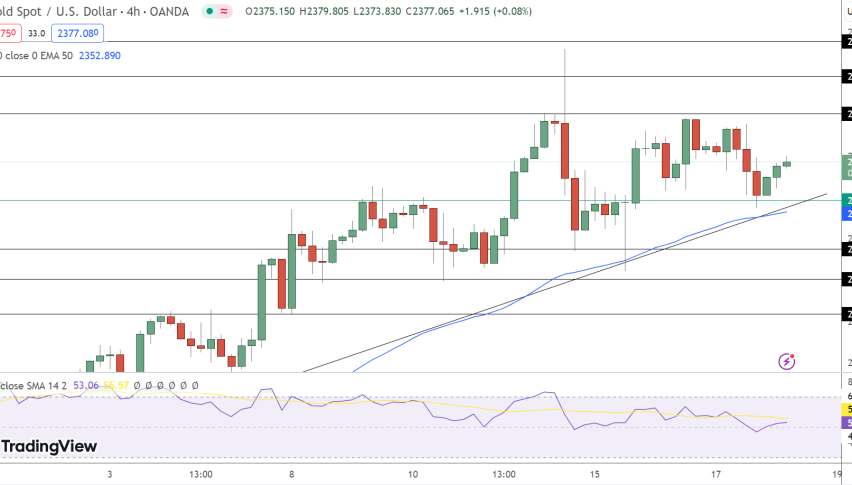
Gold dipped dramatically by more than 127 pips to trade at $1224, whereas the Dollar Index (DXY), which tracks the performance of the greenback against a basket of 6 major currencies, soared to trade at 100.67, as Trump commented in a meeting with the airline executive that "we're going to be announcing something over the next, I would say, two or three weeks that will be phenomenal in terms of tax". Moreover, the upbeat jobless claims data also supported the Greenback.
Besides Bullion, the Forex market also traded on sentiments. Evoking the live market update shared yesterday on 9th Feb in the New York session titled "Trump Opens His Mouth, the Buck Pops Higher, We Take the Pips Home", it explains the inconsistencies in the currency market. Let me share the insights on the market to help you in plan your trading day.
Today on Friday, the last trading day of a week, investor's focus well remain on:
GBP: Manufacturing Production m/m
CAD: Employment Change
CAD: Unemployment Rate
USD: Prelim UoM Consumer Sentiment
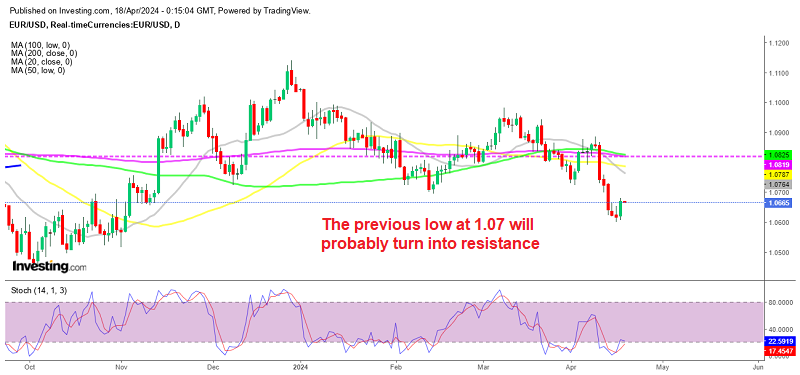
EUR/USD
In the early Asian sessions, the EUR/USD is trading at $1.0666, adding +0.0007 points and +0.07% after falling sharply to place a low at $1.06488. However, the market is likely to take a breather before further movement in the pair.
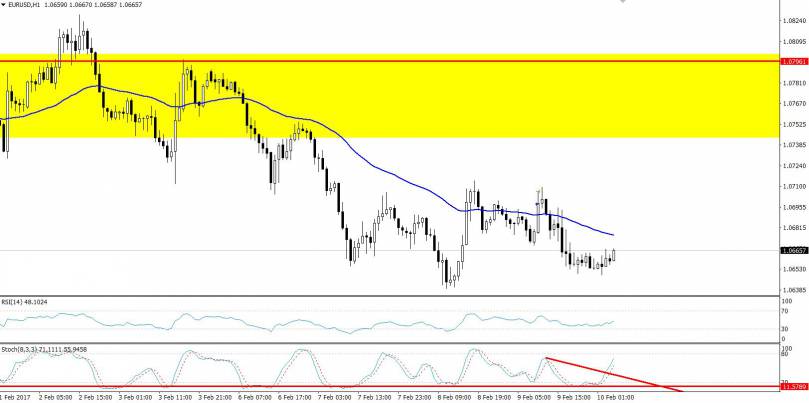
Looking at the chart, we can see that the pair is holding above a double bottom support level of $1.06421 while staying below $1.0703. Besides that, a descending triangle pattern in 1- Hour timeframe is also arousing the interest of investors to keep their focus on breakout.
However, in my opinion, selling the EUR/USD pair around $1.0680 will be a good idea. However, investors should keep an eye on the high impacted economic figures releasing today by the U.S, as it will determine the further trends in the market.
USD/CAD
Elsewhere, the USD/CAD trades at $1.3126, down -0.0019 points -0.14% in the early trading sessions. The Loonie commodity currency remained supported as the crude oil surged to trade at $53.45.
Moreover, Canada announced the statistics that new housing price inflation expanded 0.1% in December, missing the expectations for an advance of 0.2% and following a 0.2% addition in the previous month.

While I was reading the chart, I figured out that the USD/CAD mostly traded sideways as both currencies in a pair remained firm on relative fundamentals. However, the technical analysis suggests a trading range of $1.3196 – $1.3092. The RSI above 51 is providing another support to the pair.
Don't forget about descending triangle pattern in 4-hour timeframe. Investors need to keep an eye on a strong support level of the $1.3110. Buying is recommended above this level with a stop loss below $1.3075.
USD/JPY
Interestingly, the safe haven currency, Japanese Yen, lost its appeal on Trump's remarks regarding Tax cuts. So, the USD/JPY edged higher, trading bullish at $113.71 and adding +0.46 and +0.41% in the Asian session.

Highlighting the technical side, the USD/JPY has broken above a resistance level of $113.595, while another hurdle is found at the double top level of $113.930.
Wait for it, guys, as it can give us a potential trade opportunity since the pair trades is in an overbought territory. So, keep your eyes on $113.900 as selling below this level can secure us 30 – 40 pips.
Happy Trading!