February 16th Morning Brief – Upbeat U.S Inflation vs. Janet Yellen
Great profits are followed by greater volatility in the market. As discussed in our 15th of Feb Morning Brief, the market remained highly volatile during the New York trading session. Yesterday, we saw a dual move in the market; The Dollar Index, a measure of the greenback's strength against a number of other major currencies, initially soared to $101.76, however, the gains were limited and the index plunged to close at $101.09, down by -0.12% for the day.
What prompted this dual movement in the market?
U.S. Inflation Figures – Bullishness in the Dollar
Firstly, the bullishness in the U.S. Dollar was initiated with the release of favorable inflation figures. According to the U.S. Bureau of Labor Statistics, the consumer price index (CPI) increased by 0.6% last month, beating the forecasts for a 0.3% rise. However, the consumer prices climbed 2.5% y/y, rousing the sentiment of a Fed interest rate hike in 2017.
Fed Chair Janet Yellen Testifies – Bearishness in the Dollar
Secondly, the market reversed dramatically after the Fed Chair, Janet Yellen, testified before the House Financial Services Committee. We have seen some tensions over the selection of three new members and their stance on policy. Jeb Hensarling stated that "we must be vigilant to ensure that our central bankers do not one day become our central planners."
5 Things to Watch Today:
- EUR: ECB Monetary Policy Meeting Accounts
- USD: Building Permits
- USD: Philly Fed Manufacturing Index
- USD: Unemployment Claims
- USD: Housing Stats
EUR/USD, The Top Traded Currency Pair
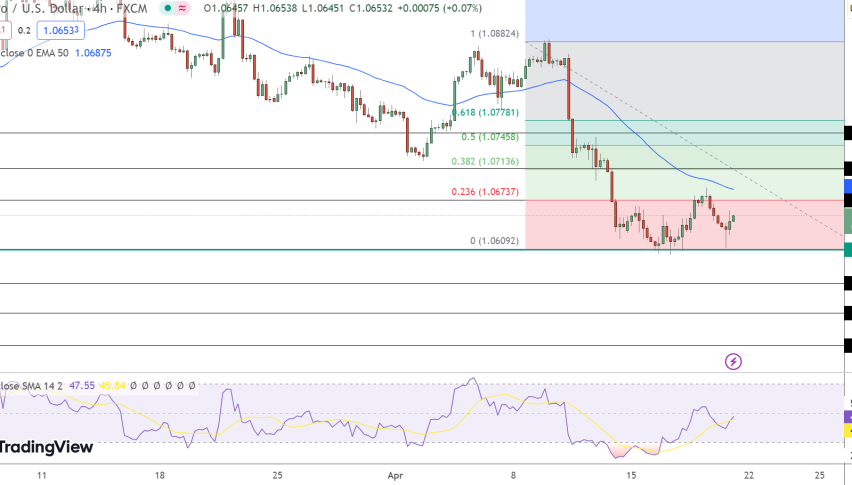
The EUR/USD is trading slightly bullish at 1.0619, up +0.0020 points and +0.19%, with a session high of $1.06229 and a low of $1.0590. As we know, the pair maintained a bearish momentum and traded lower to fall more than 200 pips since last week. However, the market situation is diverting now.
Looking at the daily chart, you will find a hammer candlestick formation followed by a multi weeks bearish trend, demonstrating that bears are exhausted and buyers are looming around the area. Besides that, the RSI value has crossed over 50, coming out of an oversold territory along with 50 periods EMA, favoring a bullish momentum in the pair.
In the 1-hour timeframe, we will notice that the market has violated a descending trend line resistance level of a $1.0594, making it a support at the moment.
Based upon the market analysis, I would recommend sell below $1.0636. This can be a good trade idea with a take profit at $1.0592 and $1.0565.
USD/JPY – The Safe Haven Currency
Likewise, the USD/JPY also traded mixed on Wednesday as the U.S. Dollar strengthened with a better than expected CPI, and later it weakened on Yellen's testimony. At the moment, the pair is trading at $113.83, down -0.31 points and-0.27% in the Asian session.
President Shinzo Abe remained optimistic about his meeting with President Trump. Mr. Abe announced the consensus to keep the forex issues with their finance leaders to calm down the tensions between the U.S. and Japan.
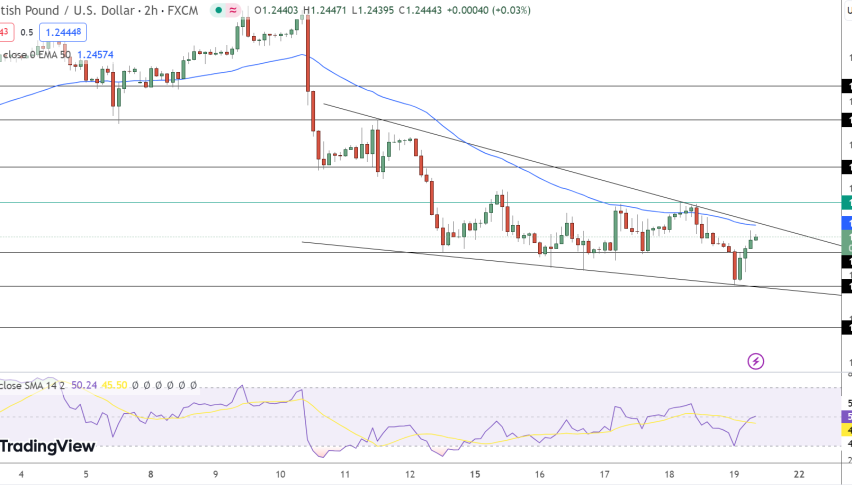
In the above chart, we see that USD/JPY is holding at $113.83, right below a major resistance level of $114.100 and above a support level of $113.750. Looking at the oscillator, the RSI is holding below 50, along with the pair that's trading below EMA's, both favoring the bearish trend in the pair.
Well, from a trading point of view, I would recommend to keep an eye on $113.835 & $113.525, as above these levels, we may see a pull back until $114.425 along with stops below suggested levels.


