February 17th Morning Brief – The U.S Dollar Hits a Weekly Low


Fellows, I hope you are excited about the last trading day of a week. To me, it's always an amazing feeling since we were making quite a good number of pips over the whole week.
Let's take a look what's going on in the market.
Yesterday, as we discussed in our 16th of Feb Morning Brief and in our live market updates on crude oil entitled "2 Major Reasons Behind a Drag in the WTI Crude Oil", the commodities moved exactly as planned. We hit another good shot, securing 70 pips on EUR/USD, 30 pips on precious gold, and 19 pips on the WTI crude oil.
The U.S Dollar continued its bearish momentum for the 2nd consecutive trading day. It fell more than 0.50%, despite positive economic indicators from the U.S economy. Particularly, the Labor Department of U.S reported an increase in unemployment claims by 5000. The actual figure came out as 239K, missing the expectation of 234K. But, in my opinion, it's not the reason behind the huge sell-off in the greenback as the sentiment was compensated by the Philly Fed Manufacturing Index that surged to 43.3, beating the previous figure of 23.6 in January.
4 Things to Watch Today:
- EUR: Current Account
- GBP: Retail Sales m/m
- CAD: Foreign Securities Purchases
- USD: CB Leading Index m/m
EUR/USD, The Top Traded Currency Pair
The EUR/USD continued its bullish ride on Thursday as the Dollar remained weak against a number of other major currencies. Yesterday, the pair edged higher to add 75 pips, having placed a daily high of $1.0679 and a low of $1.06727.
While exploring the macro and micro-economic events, we don't find any solid fundamental that's supporting this bullish move. However, we can see a clear-cut reason in the daily chart. It's a candlestick pattern hammer which is followed by a bearish trend, demonstrating that the sellers are exhausted and have encouraged the buyers to enter the market.

At the moment, it's trading neutral at $1.0673, down -0.0001 points and -0.01% in the early trading sessions. Technically, the oscillators along with the EMA's suggest a buying tone in the pair. I can see an immediate resistance at $1.06760, whereas a support prevails at 1.06515.
We can have selling positions below $1.0676, having placed a stop loss above $1.06850 and a take profit around $1.0650.
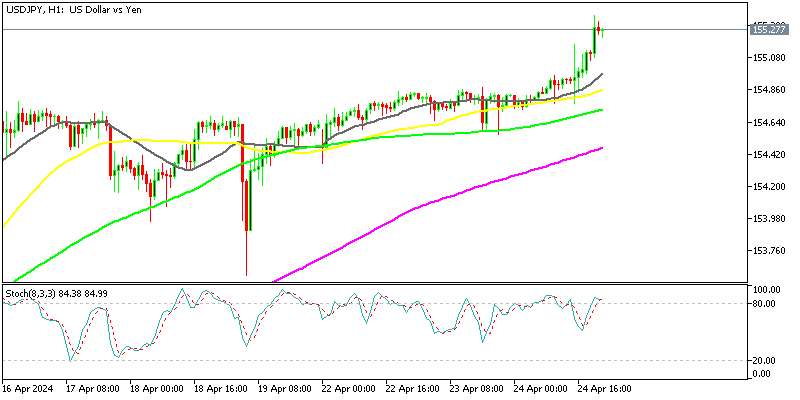
USD/JPY – The Safe Haven Currency
Japanese Yen, the safe haven currency, remained supported from the developments around the globe. In particular, the unclear stance of Trump and Brexit, tightened U.S labor market figures, and the recent comments by Fed Chair, Janet Yellen, where she signaled that the March rate hike is less likely by stating that the U.S economy is "coming close to achieving Fed mandates”.

We can see in the above chart that the USD/JPY is trading slightly higher at 113.43, up +0.18 points and +0.16%, holding right below 38.2% Fibonacci retracement level of $113.450. We can see another significant resistance at $113.650. Overall, the trend is not much clearer but we can have a short position near $113.650, aiming a target level of $113.150 with a stop loss above $113.900.